Fig. 4
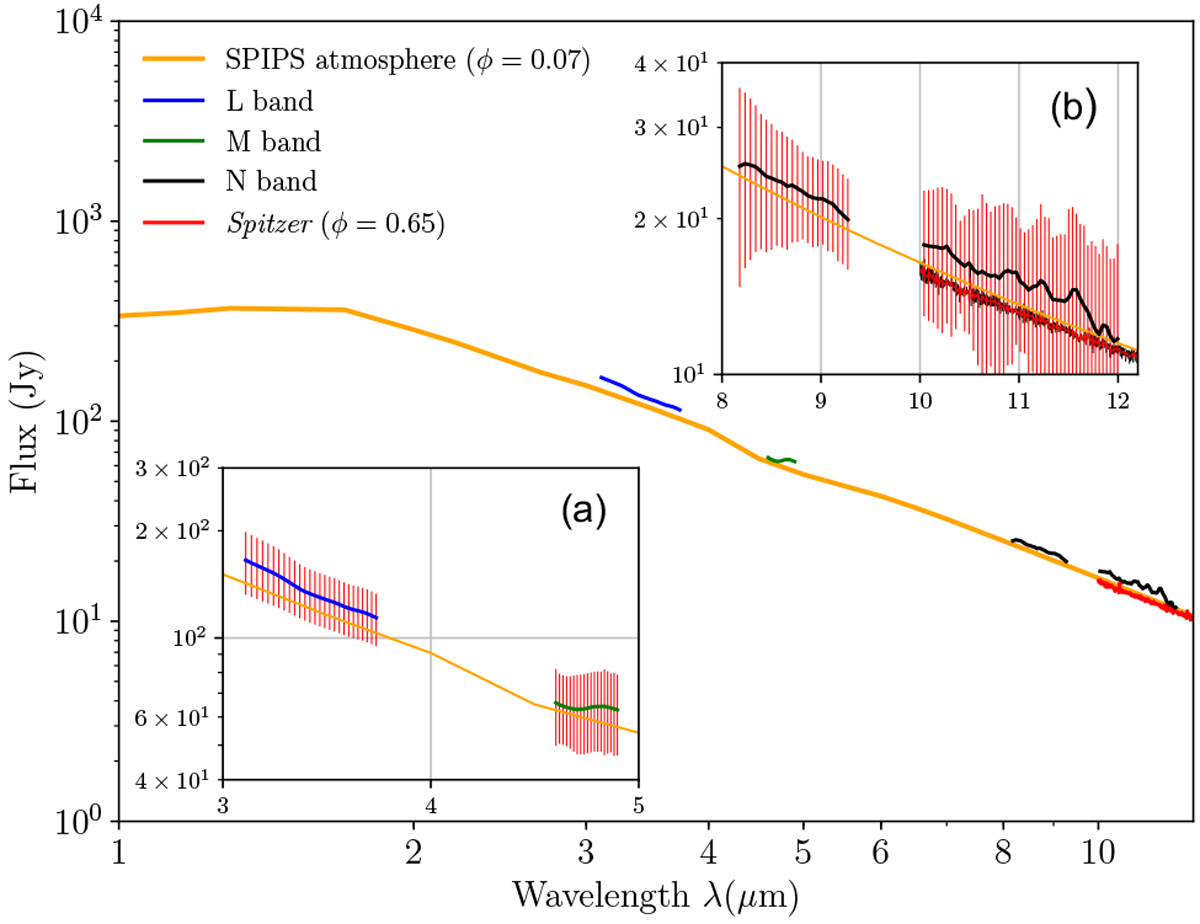
Averaged calibrated total flux for observations 1, 2, and 3 in LM bands plus the correlated flux in N band for observation 3. Panels (a) and (b) refer to LM and N bands respectively. SPIPS photosphere model is interpolated at the phase corresponding to the MATISSE the observation with parameters: Teff(ϕobs) = 5014 ± 15 K; log g(ϕobs) = 0.96 ± 0.10; and θUD(ϕobs) = 2.887 ± 0.003 mas. The Spitzer spectrum used in Sect. 2.2 is plotted for comparison.
Current usage metrics show cumulative count of Article Views (full-text article views including HTML views, PDF and ePub downloads, according to the available data) and Abstracts Views on Vision4Press platform.
Data correspond to usage on the plateform after 2015. The current usage metrics is available 48-96 hours after online publication and is updated daily on week days.
Initial download of the metrics may take a while.