Fig. 4
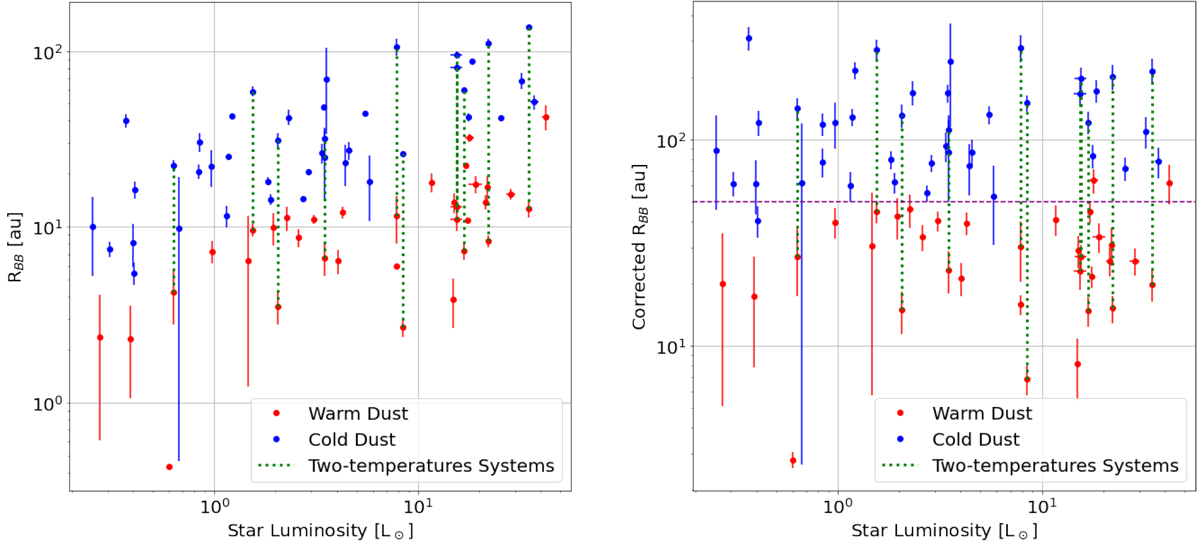
Left panel: equivalent blackbody radius of the dust disks around the 66 stars in our combined sample showing a significant mid- to far-infrared excess, for which a dust temperature could be derived. Disks classified as warm (> 100 K) and as cold (<100 K) are colored red and blue respectively. Right panel: same as left, but for the corrected blackbody radius, using the 50% astrosilicate + 50% ice composition of Pawellek & Krivov (2015). A purple dashed line at 50 au shows a rough separation between warm and cold dust populations. The vertical green dotted lines link the warm and the cold dusts that were found in the same stellar system.
Current usage metrics show cumulative count of Article Views (full-text article views including HTML views, PDF and ePub downloads, according to the available data) and Abstracts Views on Vision4Press platform.
Data correspond to usage on the plateform after 2015. The current usage metrics is available 48-96 hours after online publication and is updated daily on week days.
Initial download of the metrics may take a while.