Fig. 3
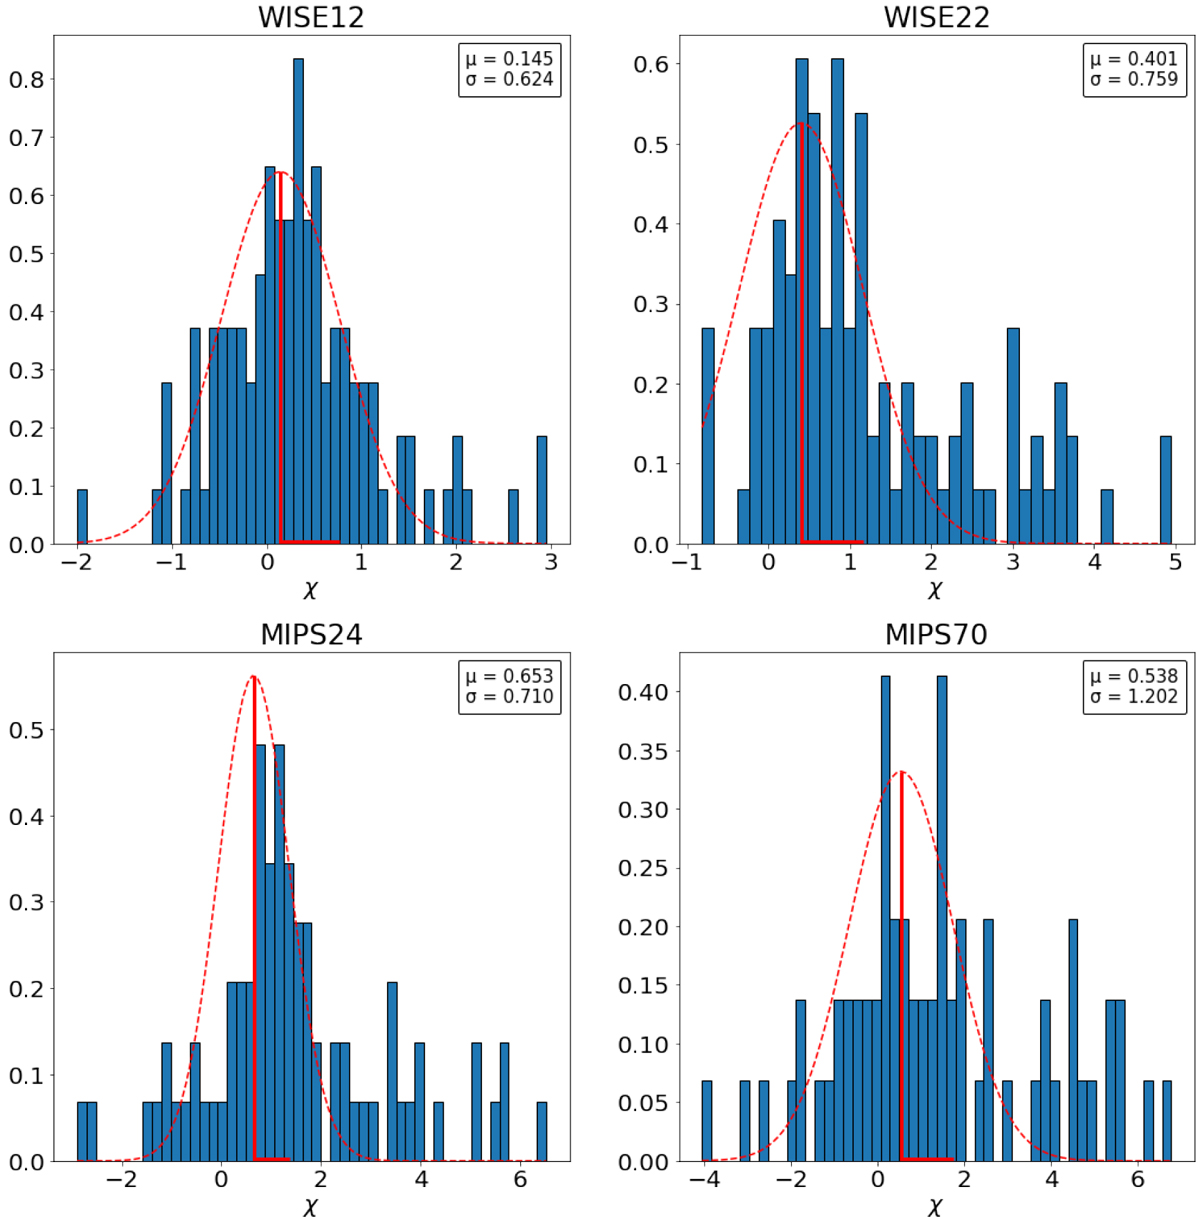
Histograms of excess significance for WISE12 (top left), WISE22 (top right), MIPS24 (bottom left), and MIPS70 (bottom right), together with their best-fit Gaussian noise distribution (red dashed curve). The mean (μ) and standard deviation (σ) of the noise distributions are also plotted respectively as red vertical and horizontal lines. Significance values lower than − 4 and higher than 8 are not displayed for the sake of clarity.
Current usage metrics show cumulative count of Article Views (full-text article views including HTML views, PDF and ePub downloads, according to the available data) and Abstracts Views on Vision4Press platform.
Data correspond to usage on the plateform after 2015. The current usage metrics is available 48-96 hours after online publication and is updated daily on week days.
Initial download of the metrics may take a while.