Fig. 2
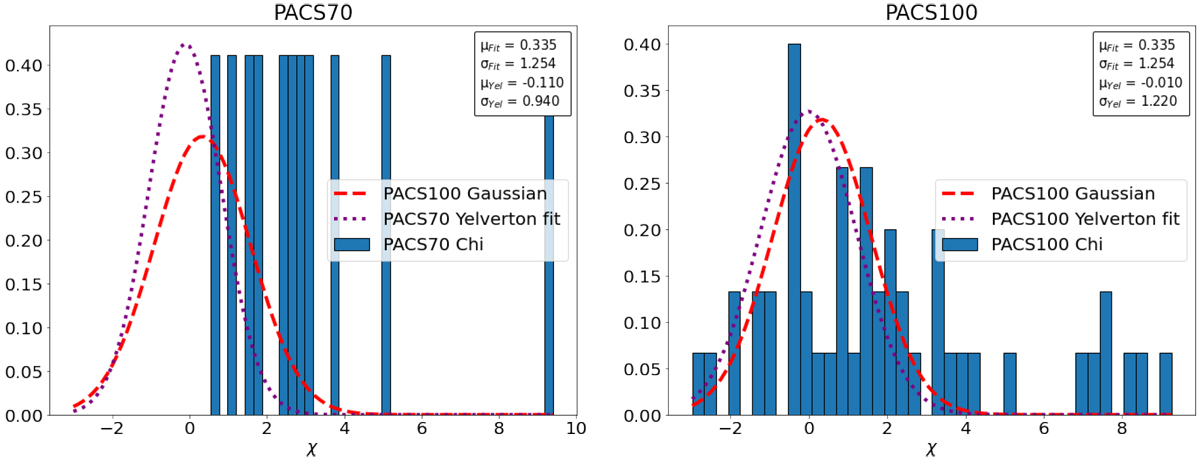
Histograms of excess significance for PACS70 (left) and PACS100 (right) measurements. The purple dotted curve shows the noise distribution derived by Yelverton et al. (2019) for their PACS70 (left) and PACS100 (right) data sets, while the red dashed curve shows the same noise distribution derived from our PACS100 data set – our PACS70 data set was not large enough to robustly fit the noise distribution. The values noted as μFit and σFit are respectively the mean and standard deviation of the significance in our PACS100 distribution, while μYel and σYel are the onesfrom Yelverton et al. (2019).
Current usage metrics show cumulative count of Article Views (full-text article views including HTML views, PDF and ePub downloads, according to the available data) and Abstracts Views on Vision4Press platform.
Data correspond to usage on the plateform after 2015. The current usage metrics is available 48-96 hours after online publication and is updated daily on week days.
Initial download of the metrics may take a while.