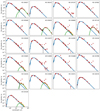
Fig. A.1
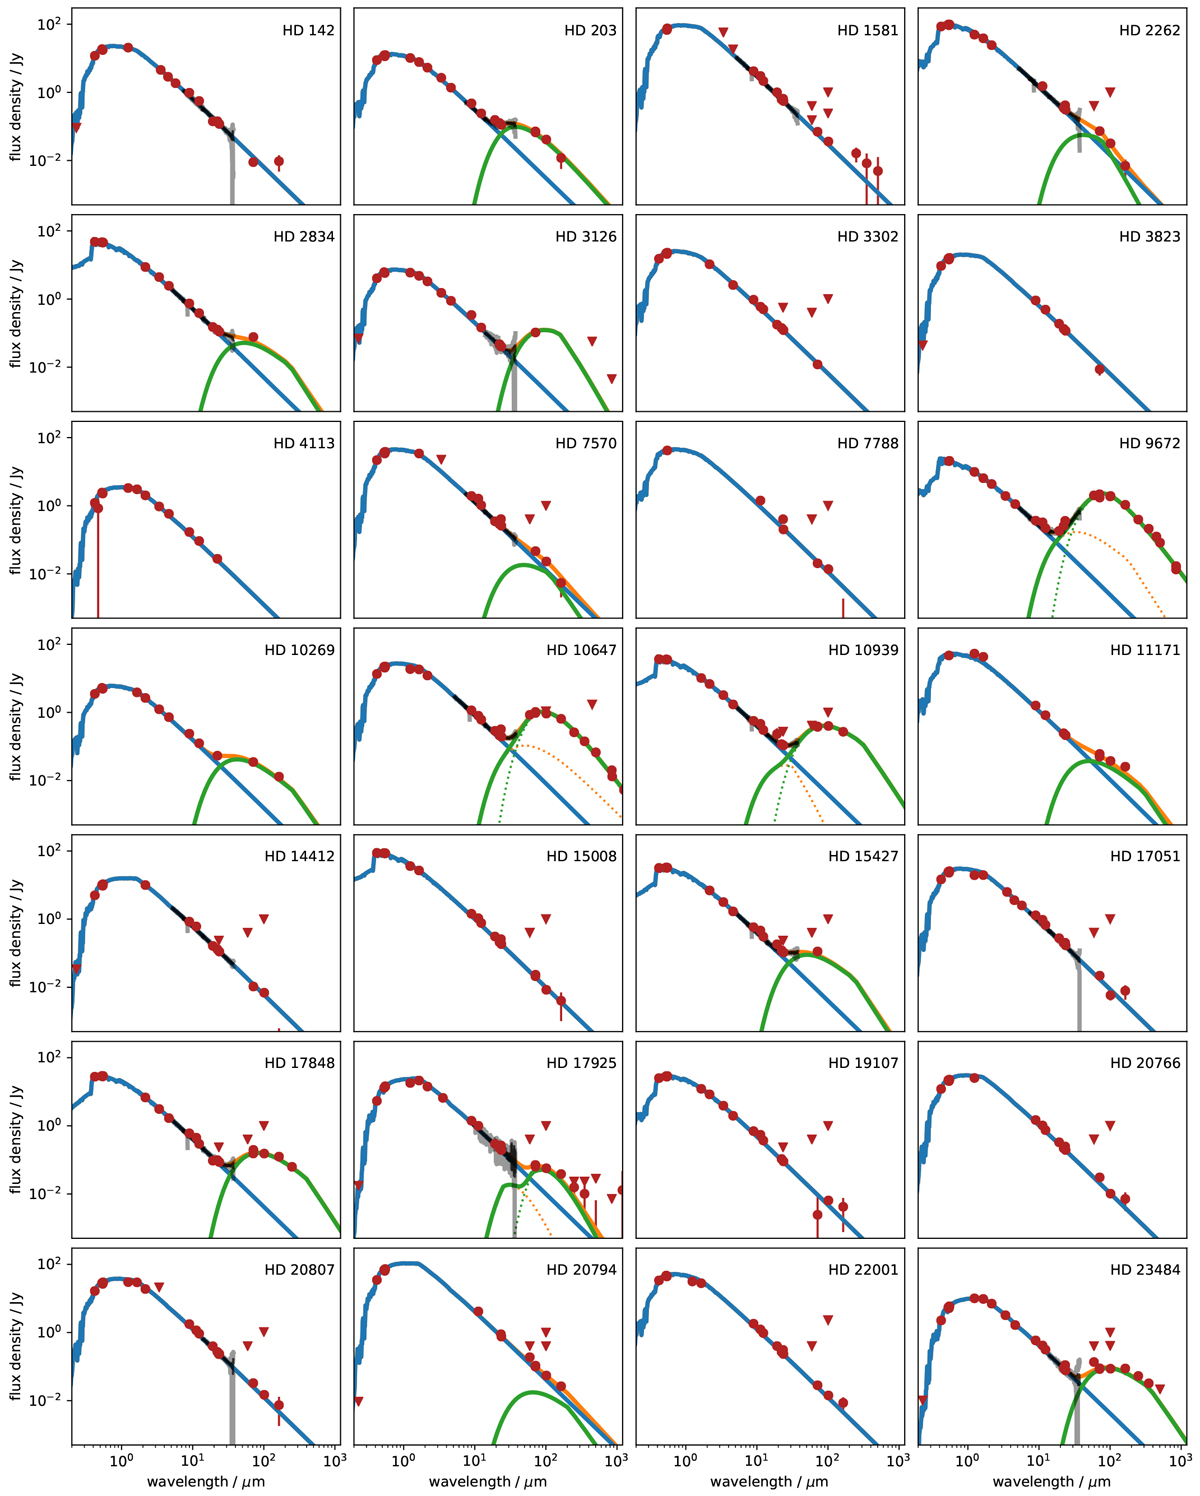
Observations and models for the targets in our survey. Each panel shows photometry as dots, upper limits as triangles, and IRS spectra as black lines. Models are shown as solid lines, with blue for the star, green for the disk, and orange for the total model. Where two are fitted, individual disk components are shown as dotted lines.
Current usage metrics show cumulative count of Article Views (full-text article views including HTML views, PDF and ePub downloads, according to the available data) and Abstracts Views on Vision4Press platform.
Data correspond to usage on the plateform after 2015. The current usage metrics is available 48-96 hours after online publication and is updated daily on week days.
Initial download of the metrics may take a while.