Fig. 8.
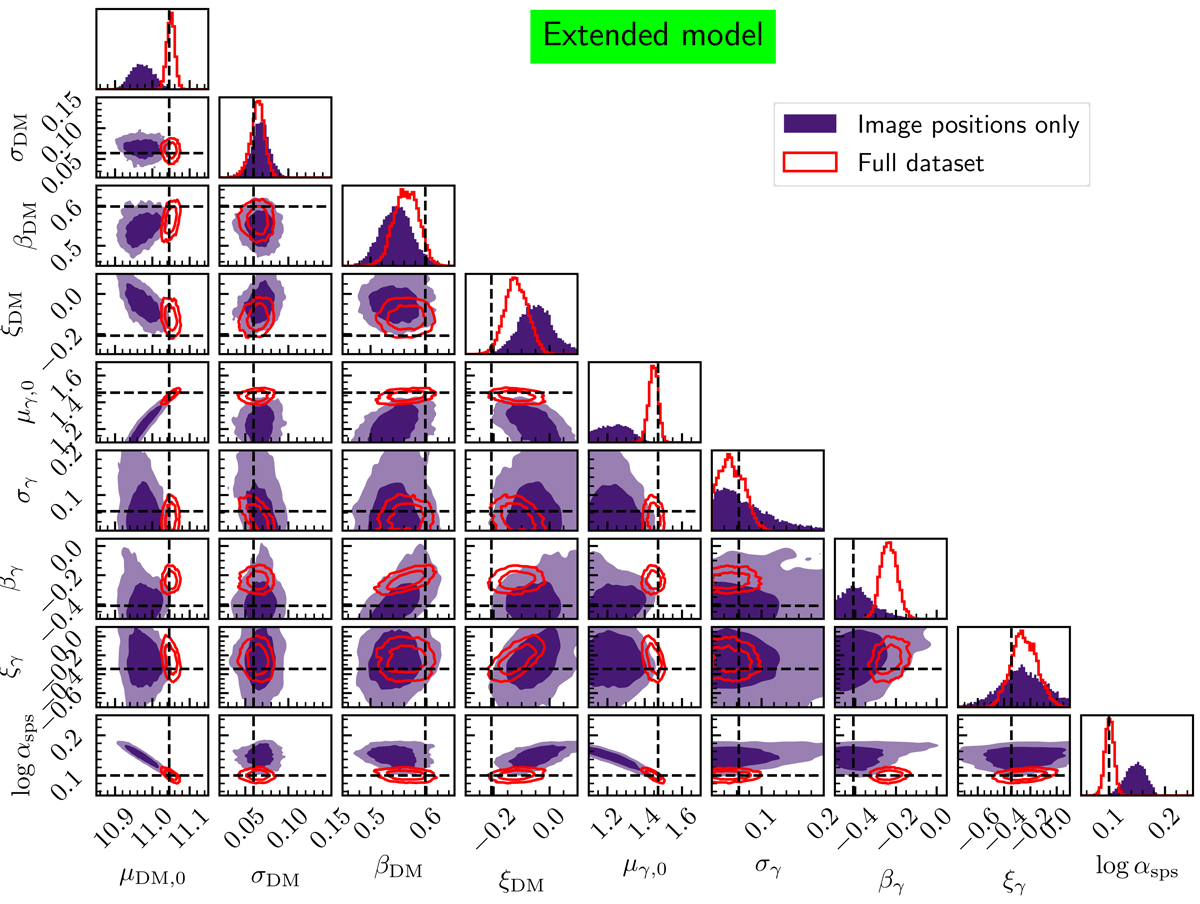
Posterior probability distribution of the hyper-parameters of the extended model introduced in Sect. 5.1 given the mock data of a sample of 1000 lenses. Red lines show the fit to the whole dataset (image positions and radial magnification ratios). Filled contours show the fit to image position only. Contour levels correspond to 68% and 95% enclosed probability regions. Dashed lines indicate the true values of the hyper-parameters, which are defined by fitting the each model directly to the distribution of log M200, γDM, and log αsps of the mock sample.
Current usage metrics show cumulative count of Article Views (full-text article views including HTML views, PDF and ePub downloads, according to the available data) and Abstracts Views on Vision4Press platform.
Data correspond to usage on the plateform after 2015. The current usage metrics is available 48-96 hours after online publication and is updated daily on week days.
Initial download of the metrics may take a while.