Fig. 1.
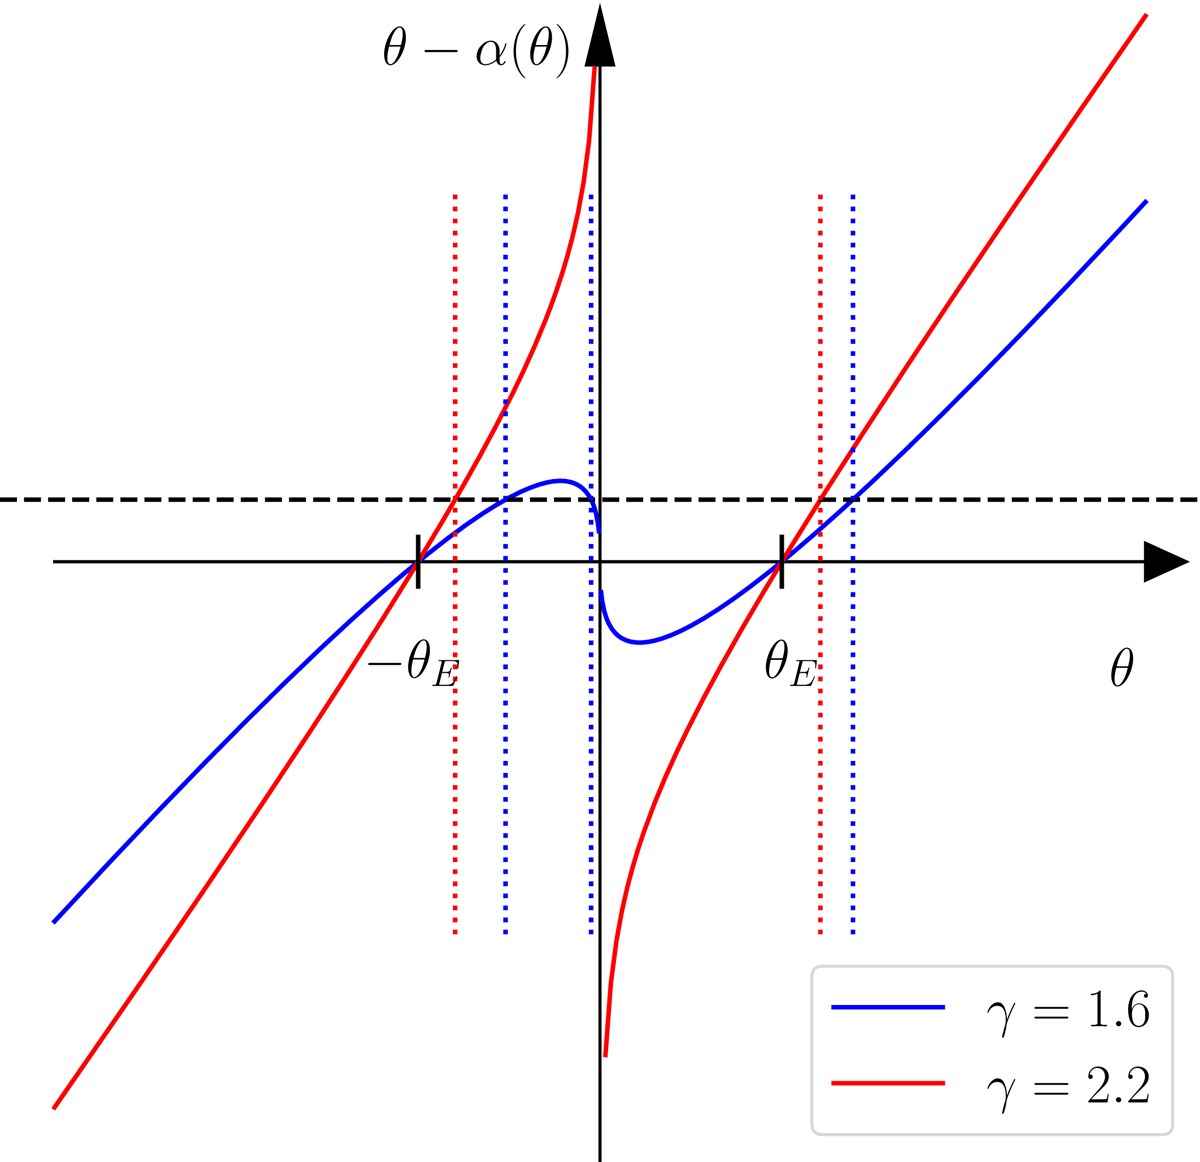
Solutions of the lens equation for axisymmetric power-law lens models. The coloured solid curves show θ − α(θ) as a function of θ for two lenses with the same Einstein radius and different values of the density slope parameter γ. The horizontal dashed line marks the position β of a background source. Its images form at solutions of the lens equation, β = θ − α(θ), indicated by the vertical dotted lines with the colour of the corresponding lens model. For the lens with density profile shallower than isothermal, γ < 2, three images form, while the γ > 2 lens produces only two images. The slope of the θ − α(θ) curve is the inverse of the radial magnification. Stationary points, only visible in the γ < 2 case, correspond to the radial critical curve.
Current usage metrics show cumulative count of Article Views (full-text article views including HTML views, PDF and ePub downloads, according to the available data) and Abstracts Views on Vision4Press platform.
Data correspond to usage on the plateform after 2015. The current usage metrics is available 48-96 hours after online publication and is updated daily on week days.
Initial download of the metrics may take a while.