Fig. 6.
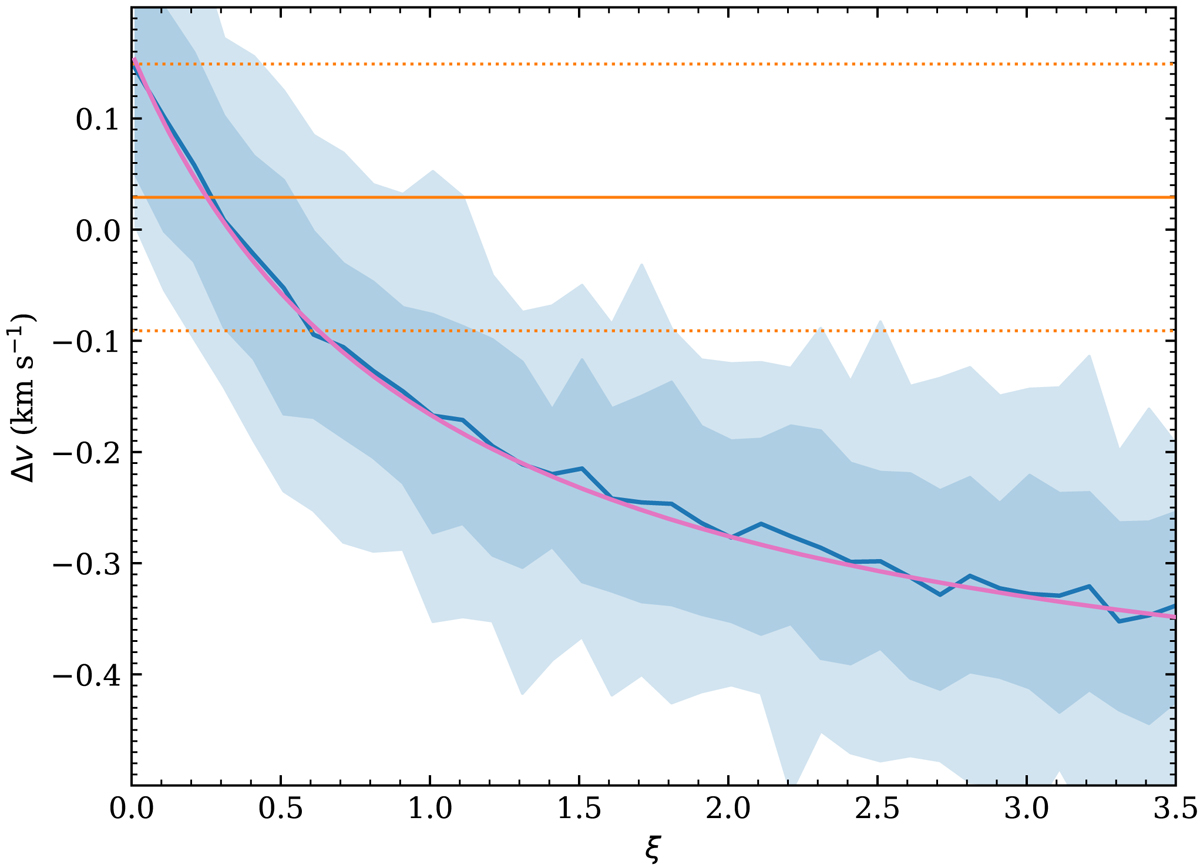
Velocity shift (with respect to lines with the standard isotopic ratio) as a function of ξ = (25Mg + 26Mg)/24Mg assuming r = 26Mg/25Mg = 1 for mock ESPRESSO data. The solid blue line corresponds to the mean value for 100 mock spectra for each input ξ value, and the dark and light-blue regions represent the regions containing 68.3% and 95.5% of the values, respectively. The pink line corresponds to a noiseless mock spectrum. The observed velocity shift and associated 1σ uncertainty for the system at z = 0.45206 are shown as orange horizontal solid and dotted lines, respectively.
Current usage metrics show cumulative count of Article Views (full-text article views including HTML views, PDF and ePub downloads, according to the available data) and Abstracts Views on Vision4Press platform.
Data correspond to usage on the plateform after 2015. The current usage metrics is available 48-96 hours after online publication and is updated daily on week days.
Initial download of the metrics may take a while.