Fig. 5.
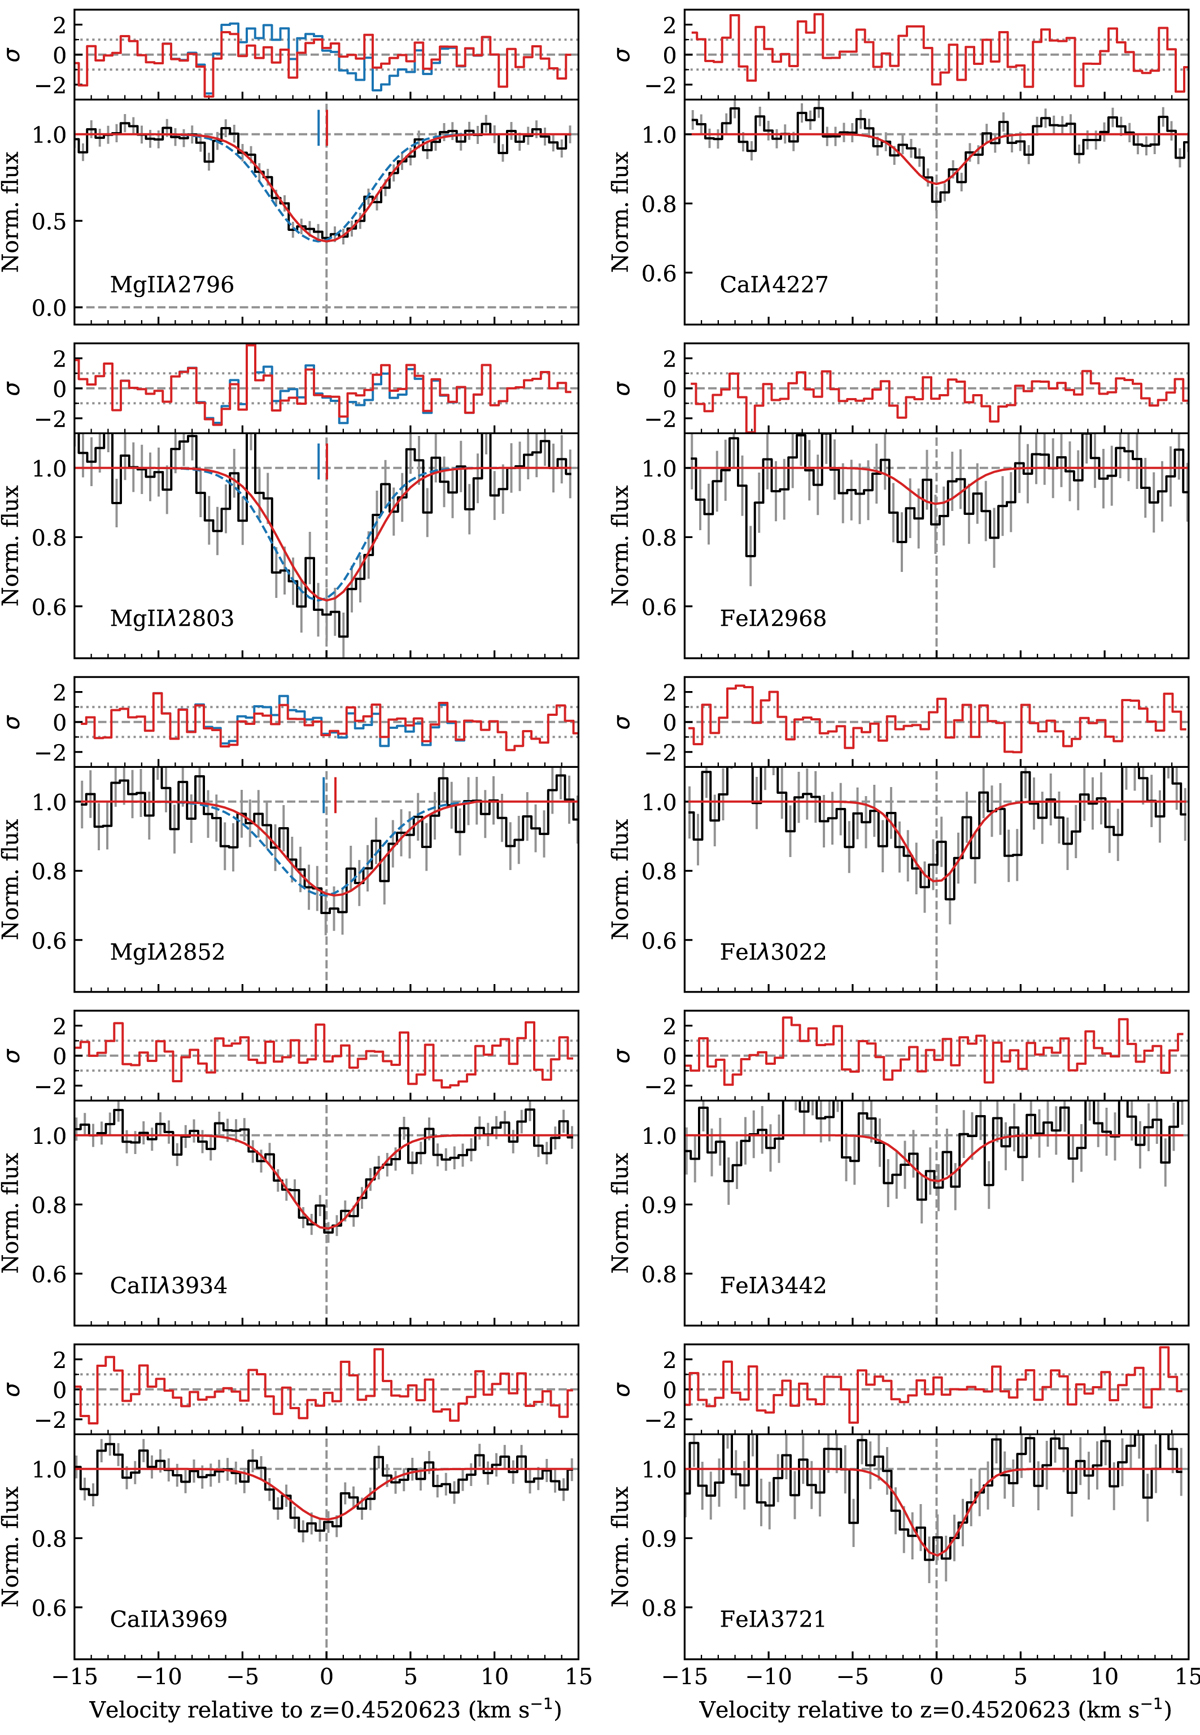
Single Voigt profile fit to the cold, narrow component at z = 0.45206 (ESPRESSO data: black with grey error bars, synthetic spectrum: red). Residuals (in units of standard deviation) are shown in the subpanel above each line panel. The zero of the velocity scale is taken at the velocity of the iron and calcium lines. The redshifts of the magnesium lines were left to vary independently from the other lines and are displayed as short red tick marks. The blue profiles and the corresponding blue tick marks and residuals correspond to the apparent velocity shift (−0.47 and −0.17 km s−1 from Mg II and Mg I respectively) measured by Agafonova et al. (2011) from UVES data.
Current usage metrics show cumulative count of Article Views (full-text article views including HTML views, PDF and ePub downloads, according to the available data) and Abstracts Views on Vision4Press platform.
Data correspond to usage on the plateform after 2015. The current usage metrics is available 48-96 hours after online publication and is updated daily on week days.
Initial download of the metrics may take a while.