Fig. 4.
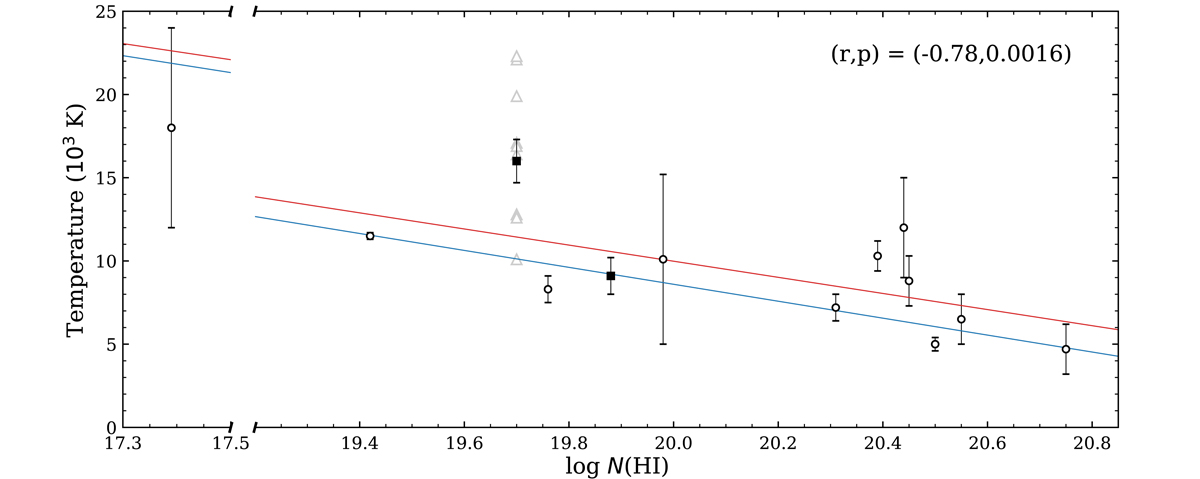
Kinetic temperatures derived from Doppler broadening in various absorption-line systems as a function of the total H I column densities of these systems. Empty circles correspond to measurements obtained thanks to the presence of deuterium (typically in one or a few close components) while filled squares correspond to average measurements in complex systems made possible by high-resolution spectroscopy. Grey triangles represent measurements in individual components of the DLA towards HE 0001−2340 (Fig. 3). The data exhibit an anti-correlation with a Pearson coefficient of r = −0.78 and a probability that this is pure coincidence of p = 0.16%. The solid blue (respectively red) line corresponds to an unweighted linear fit including (resp. excluding) the lowest N(H I) value towards Q 1009+2956.
Current usage metrics show cumulative count of Article Views (full-text article views including HTML views, PDF and ePub downloads, according to the available data) and Abstracts Views on Vision4Press platform.
Data correspond to usage on the plateform after 2015. The current usage metrics is available 48-96 hours after online publication and is updated daily on week days.
Initial download of the metrics may take a while.