Open Access
Fig. 3.
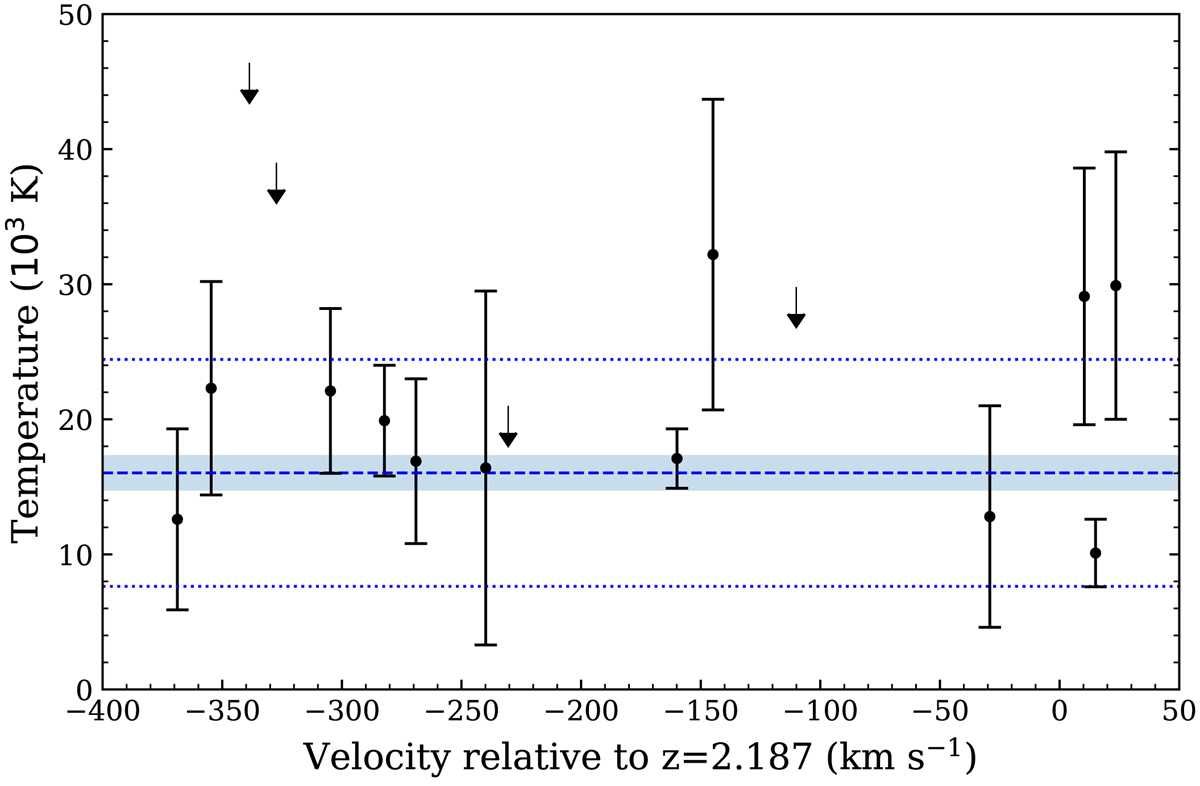
Kinetic temperatures determined in various components along the line profile of the sub-DLA at zabs = 2.187 (zero of the velocity scale). The dashed blue line and shaded area correspond to the weighted mean and associated error ⟨T⟩ = 16 000 ± 1300 K. The dotted lines show one standard deviation around this mean.
Current usage metrics show cumulative count of Article Views (full-text article views including HTML views, PDF and ePub downloads, according to the available data) and Abstracts Views on Vision4Press platform.
Data correspond to usage on the plateform after 2015. The current usage metrics is available 48-96 hours after online publication and is updated daily on week days.
Initial download of the metrics may take a while.