Fig. 2.
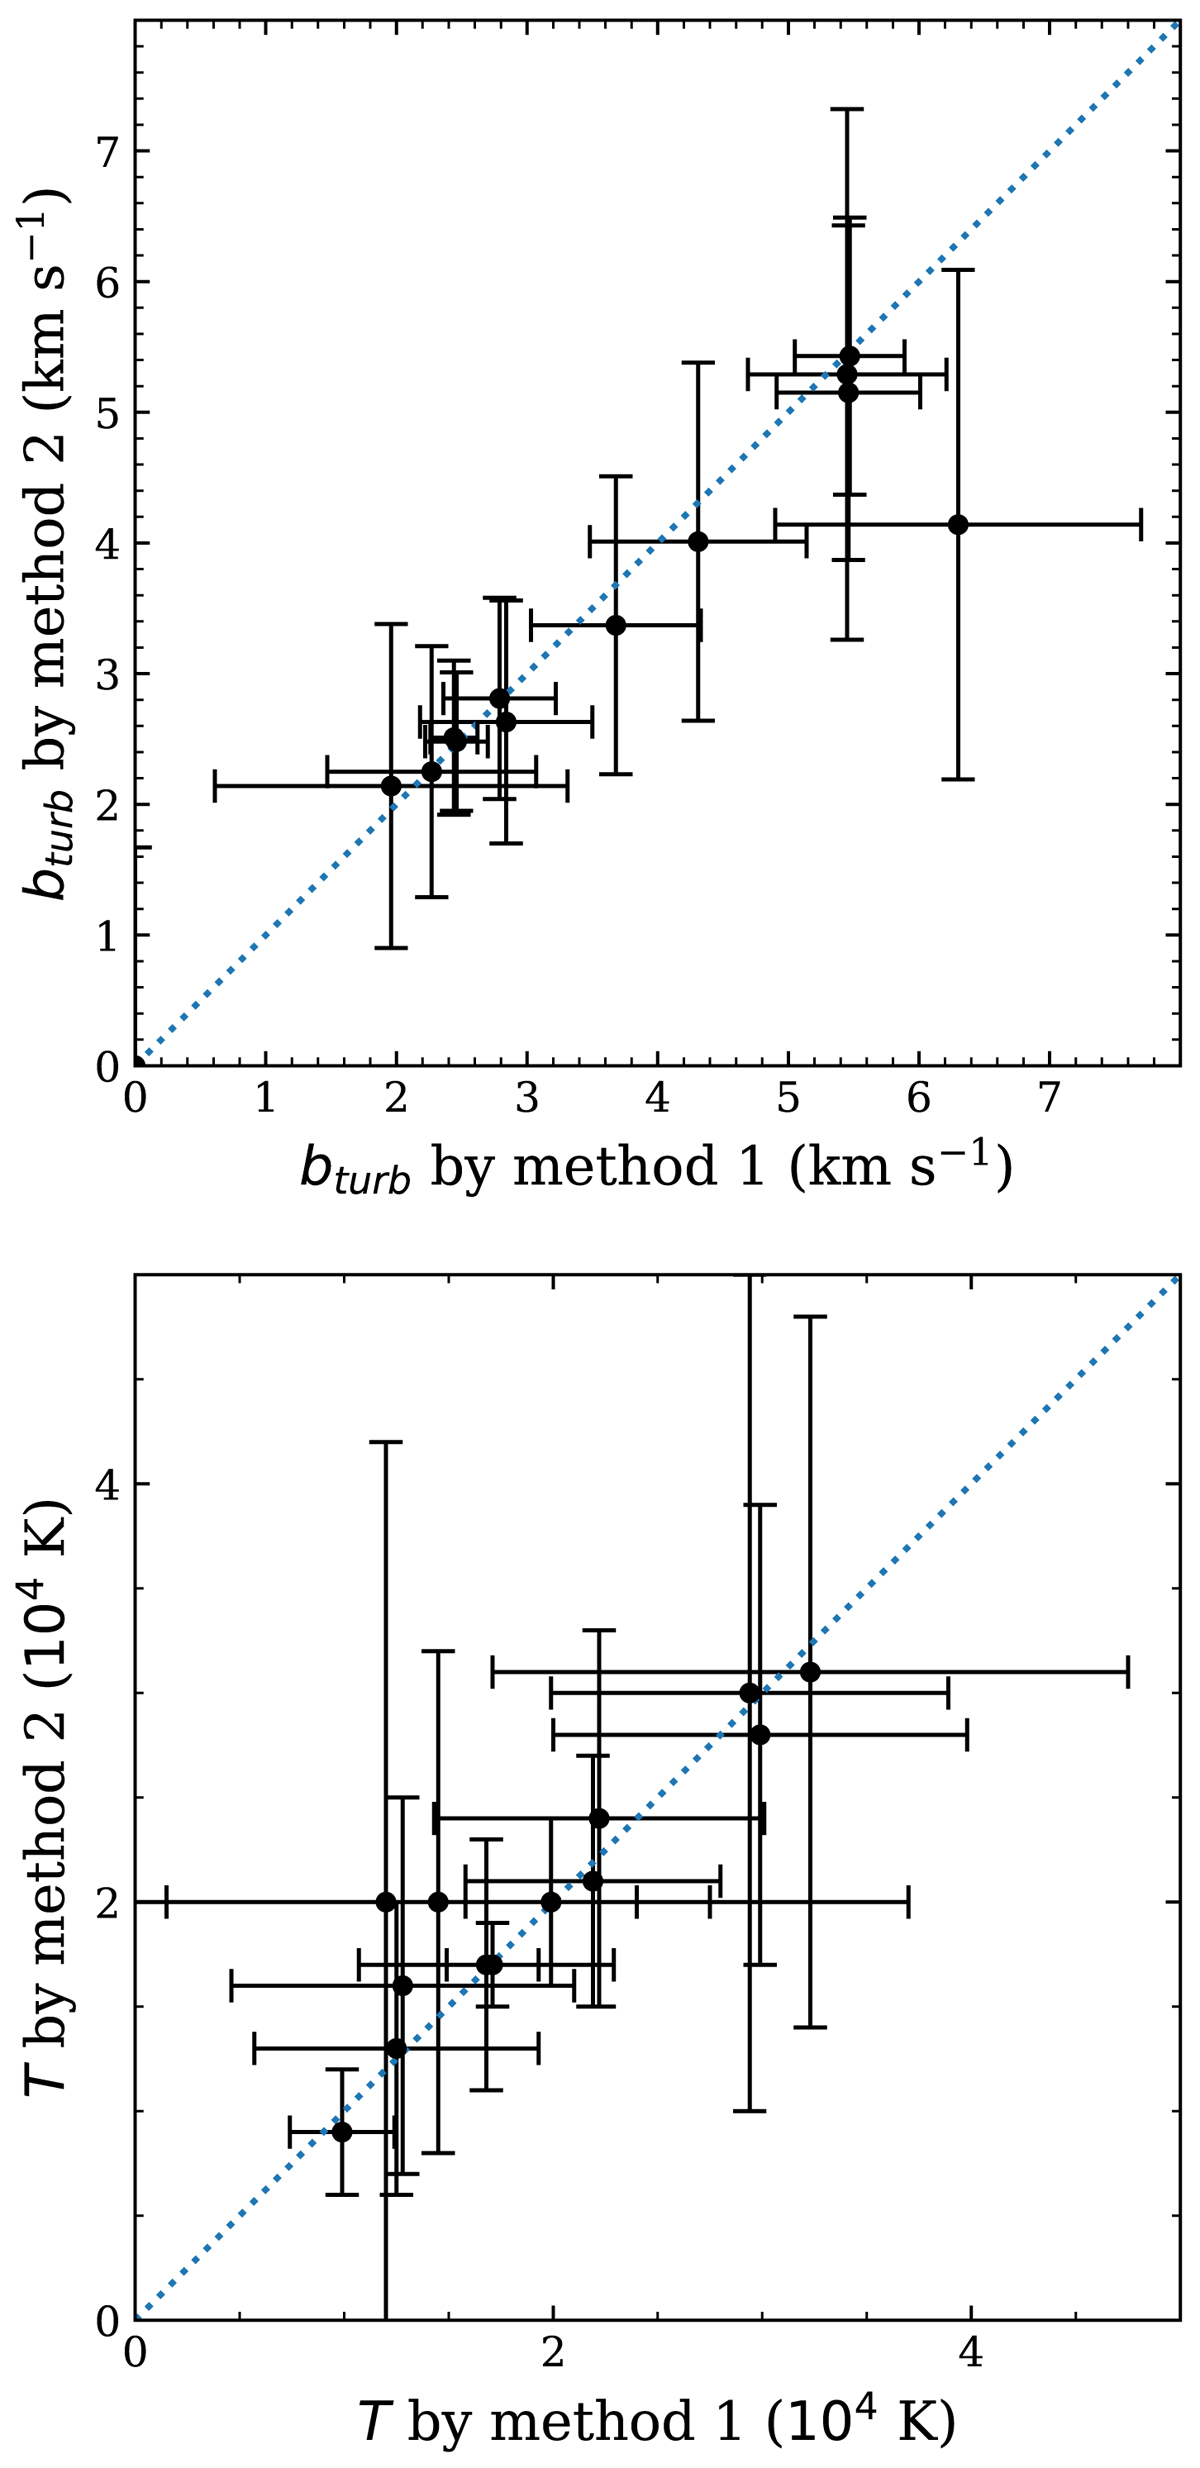
Comparison of the turbulent component of the Doppler parameter (top) and the temperature (bottom) derived from two different methods (1: using bturb and T as free parameters for all species of a given component; 2: fitting total b-values for each species and deriving bturb and T a posteriori from the variation of b with the inverse of the species mass). Blue dotted lines show the one-to-one relation.
Current usage metrics show cumulative count of Article Views (full-text article views including HTML views, PDF and ePub downloads, according to the available data) and Abstracts Views on Vision4Press platform.
Data correspond to usage on the plateform after 2015. The current usage metrics is available 48-96 hours after online publication and is updated daily on week days.
Initial download of the metrics may take a while.