Fig. A.1.
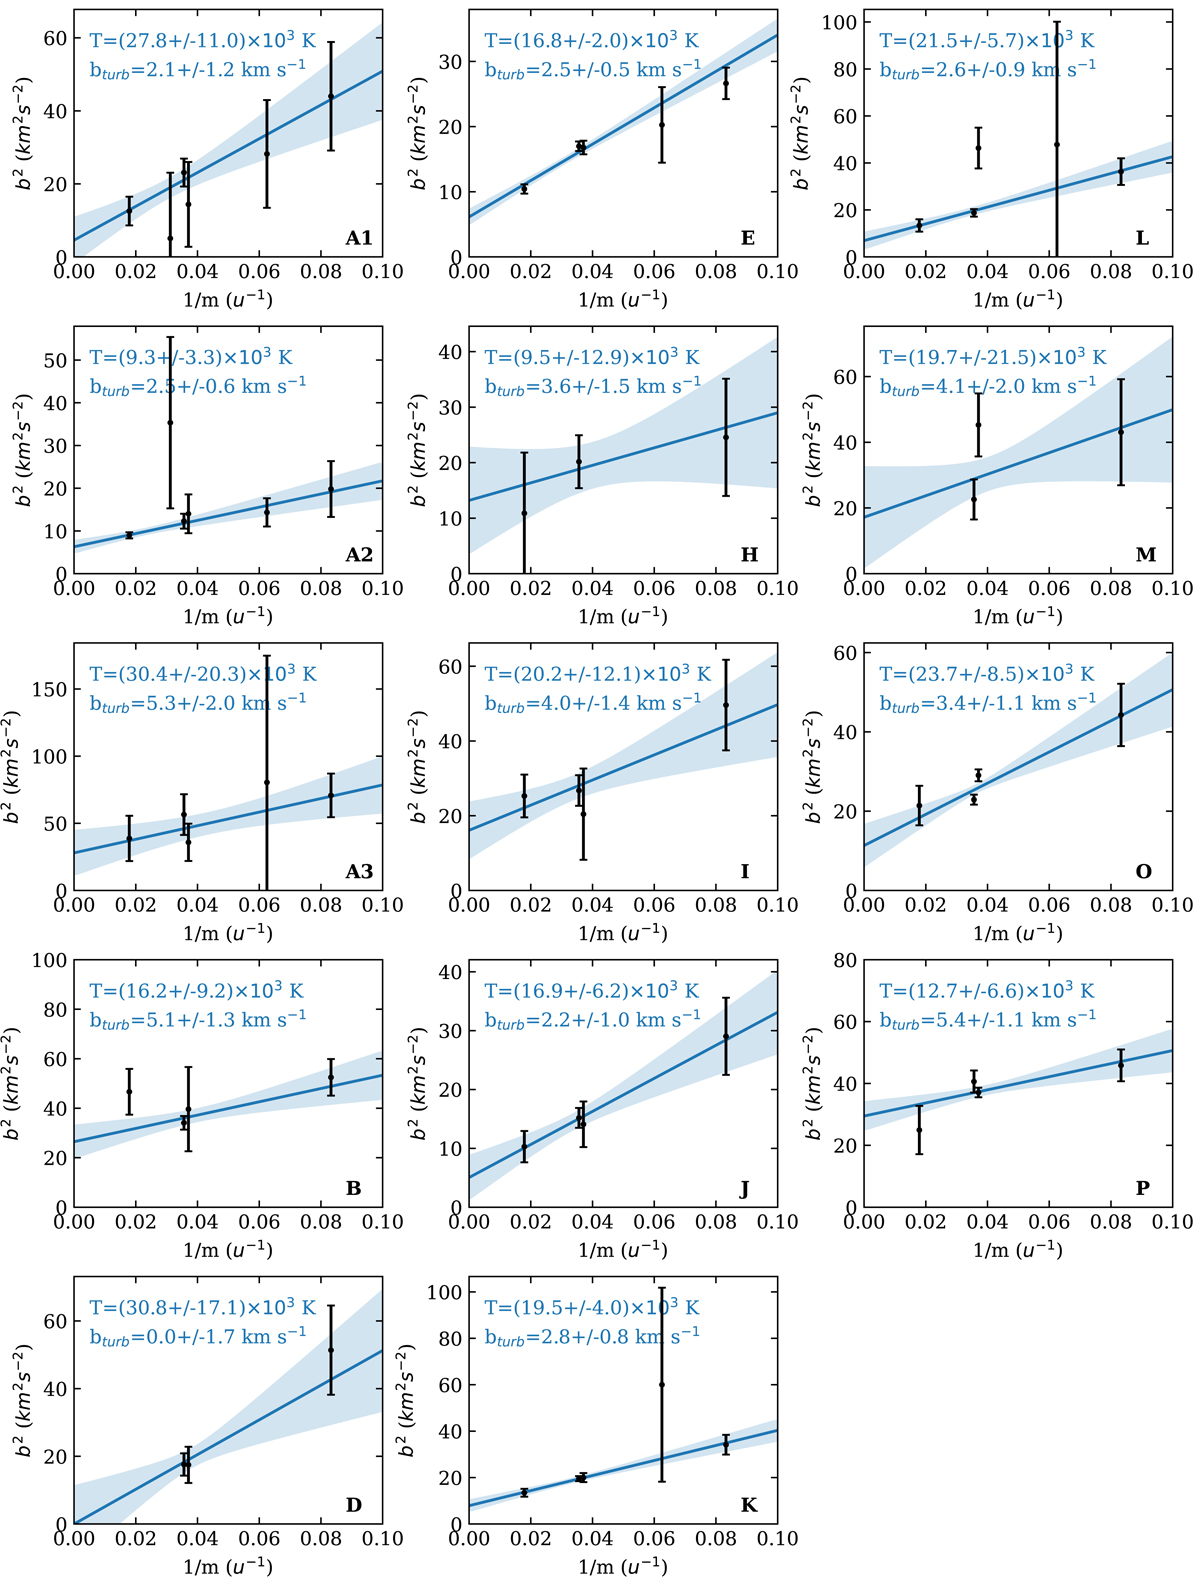
Temperature and turbulent broadening parameter determinations using independent Doppler parameters for each species (i.e. method 2) in various components. For the weakest component (C, G and N), the uncertainties are too large to provide meaningful constraints. Black points and error bars represent the square of the total Doppler parameter b measured for various species (Fe II, S II Si II, Al II, O I and C II) as a function of the inverse of their mass. The blue line and shaded area represent the linear fit to the data and 1σ confidence band.
Current usage metrics show cumulative count of Article Views (full-text article views including HTML views, PDF and ePub downloads, according to the available data) and Abstracts Views on Vision4Press platform.
Data correspond to usage on the plateform after 2015. The current usage metrics is available 48-96 hours after online publication and is updated daily on week days.
Initial download of the metrics may take a while.