Fig. 13.
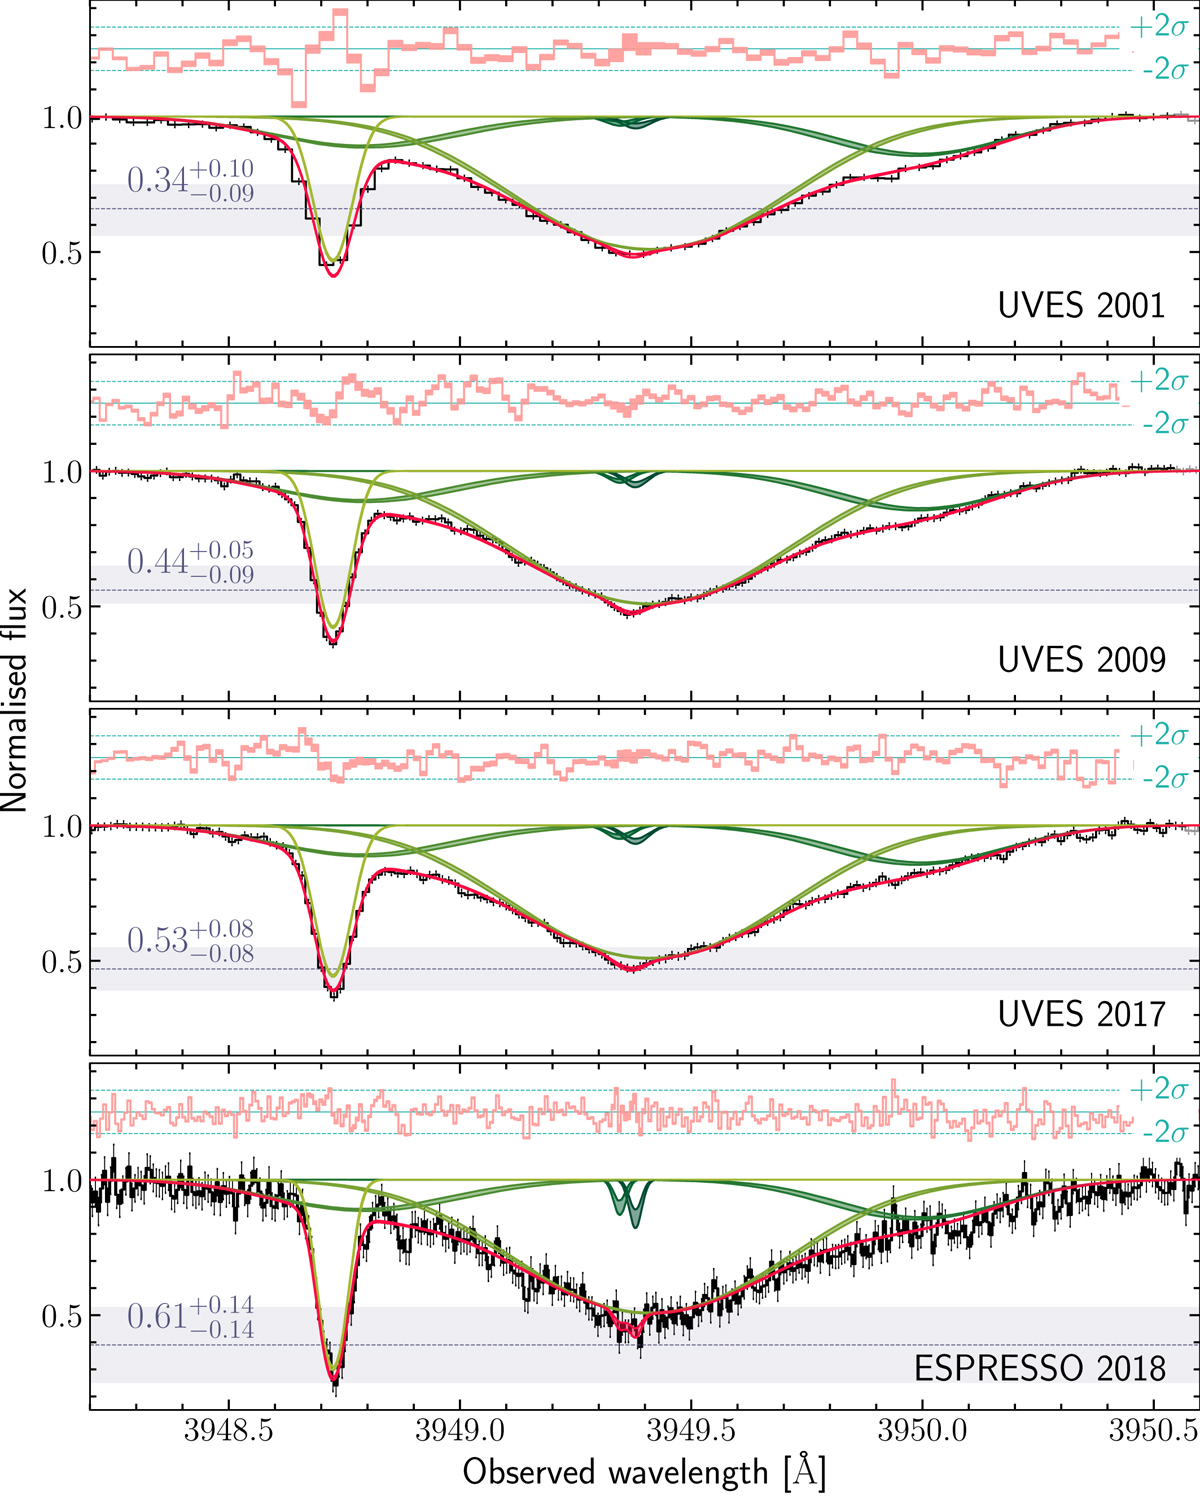
Fit to the region around Fe Iλ2719 Å line at z = 0.452. From top to bottom, the black line corresponds to the data obtained with UVES in 2001, 2009, and 2017 and ESPRESSO in 2018. The fit profiles are presented in the same manner as in Fig. 12. The horizontal dashed line and grey stripe show 1 − Cf and its uncertainty, respectively. The constrained value of Cf for each spectrum is given in the bottom-left of each panel.
Current usage metrics show cumulative count of Article Views (full-text article views including HTML views, PDF and ePub downloads, according to the available data) and Abstracts Views on Vision4Press platform.
Data correspond to usage on the plateform after 2015. The current usage metrics is available 48-96 hours after online publication and is updated daily on week days.
Initial download of the metrics may take a while.