Open Access
Fig. 11.
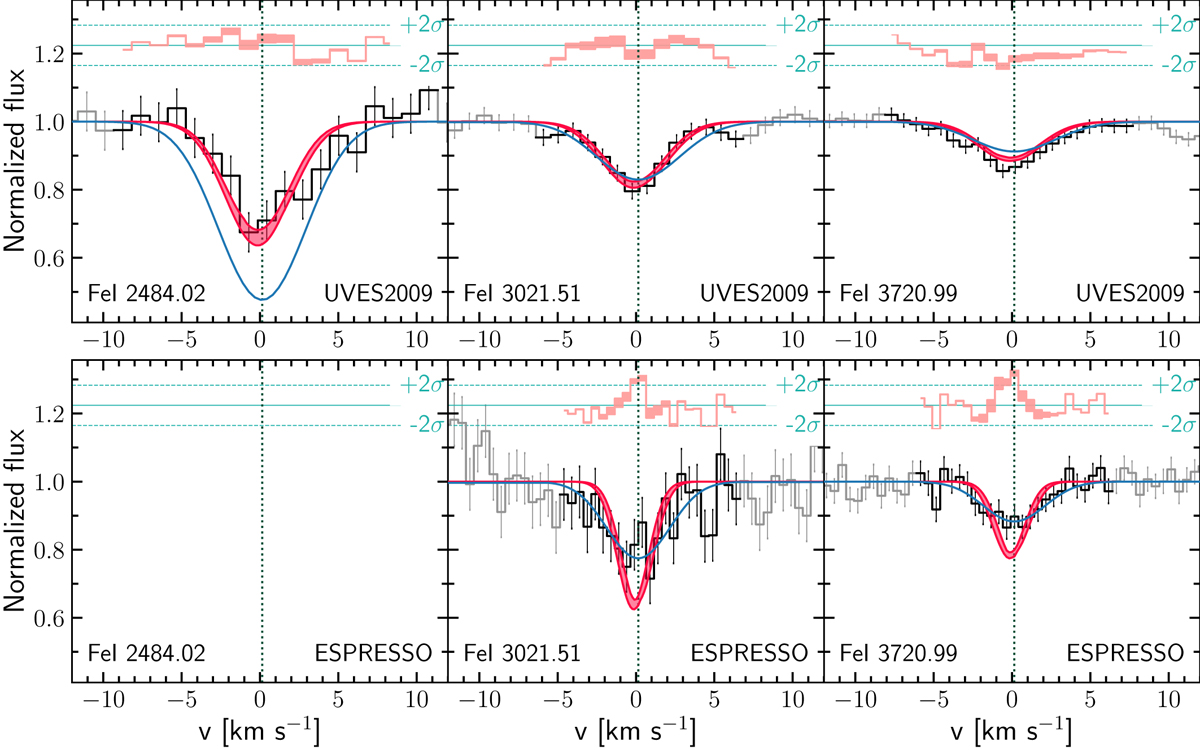
Fit to the Fe I absorption lines with one-component model. From top to bottom, the black line corresponds to the data obtained with UVES 2009 and ESPRESSO 2018 (Fe Iλ2484Å line is missed in ESPRESSO spectrum), the red and blue profiles are the one-component models constrained respectively from UVES and ESPRESSO data only.
Current usage metrics show cumulative count of Article Views (full-text article views including HTML views, PDF and ePub downloads, according to the available data) and Abstracts Views on Vision4Press platform.
Data correspond to usage on the plateform after 2015. The current usage metrics is available 48-96 hours after online publication and is updated daily on week days.
Initial download of the metrics may take a while.