Fig. 1.
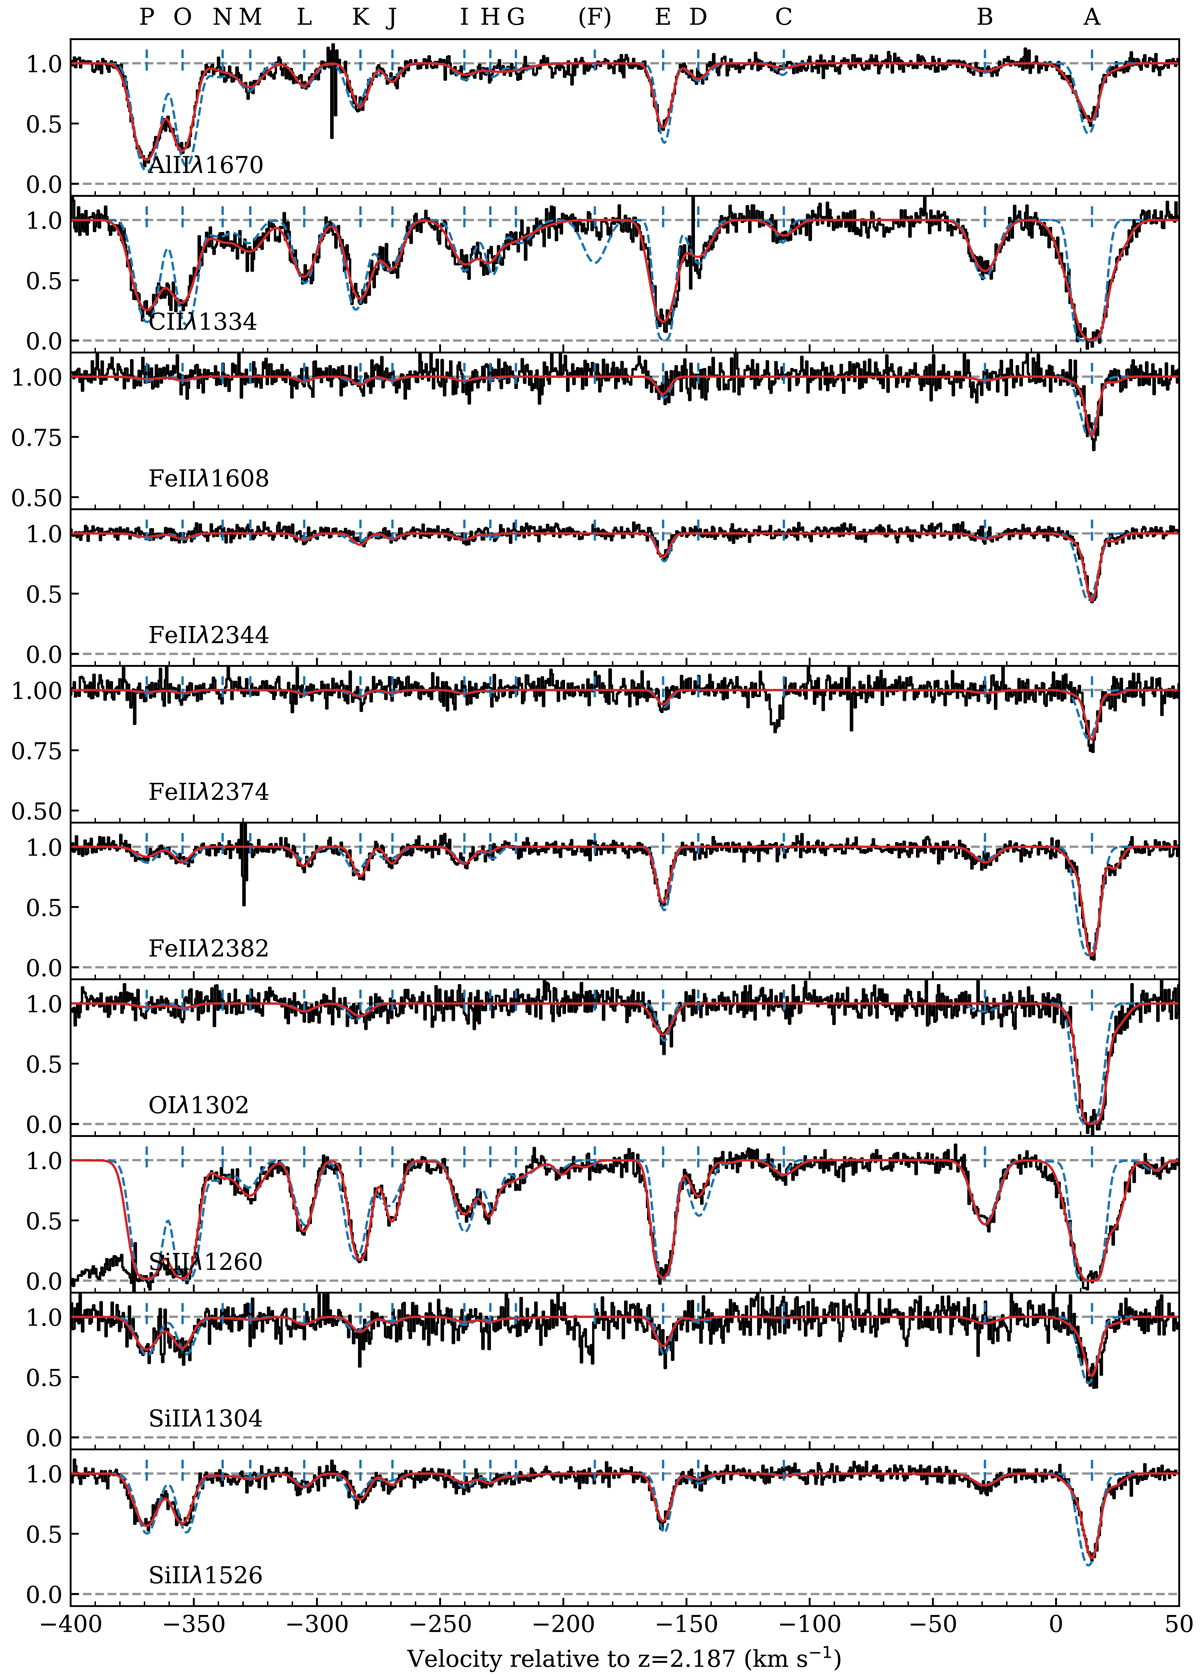
Multi-component Voigt-profile fitting of metal lines in the sub-DLA at z = 2.187. The normalised ESPRESSO spectrum is shown in black, with the best-fit synthetic spectrum overlaid in red. The blue dashed curve corresponds to the synthetic spectrum computed using the best-fit parameters obtained by Richter et al. (2005) from the analysis of UVES data. We note that their component A here splits into three subcomponents that we call A1, A2, and A3 in Table B.1 and their component F at v ∼ −150 km s−1 appears to be spurious as seen from C IIλ1334.
Current usage metrics show cumulative count of Article Views (full-text article views including HTML views, PDF and ePub downloads, according to the available data) and Abstracts Views on Vision4Press platform.
Data correspond to usage on the plateform after 2015. The current usage metrics is available 48-96 hours after online publication and is updated daily on week days.
Initial download of the metrics may take a while.