Fig. 5.
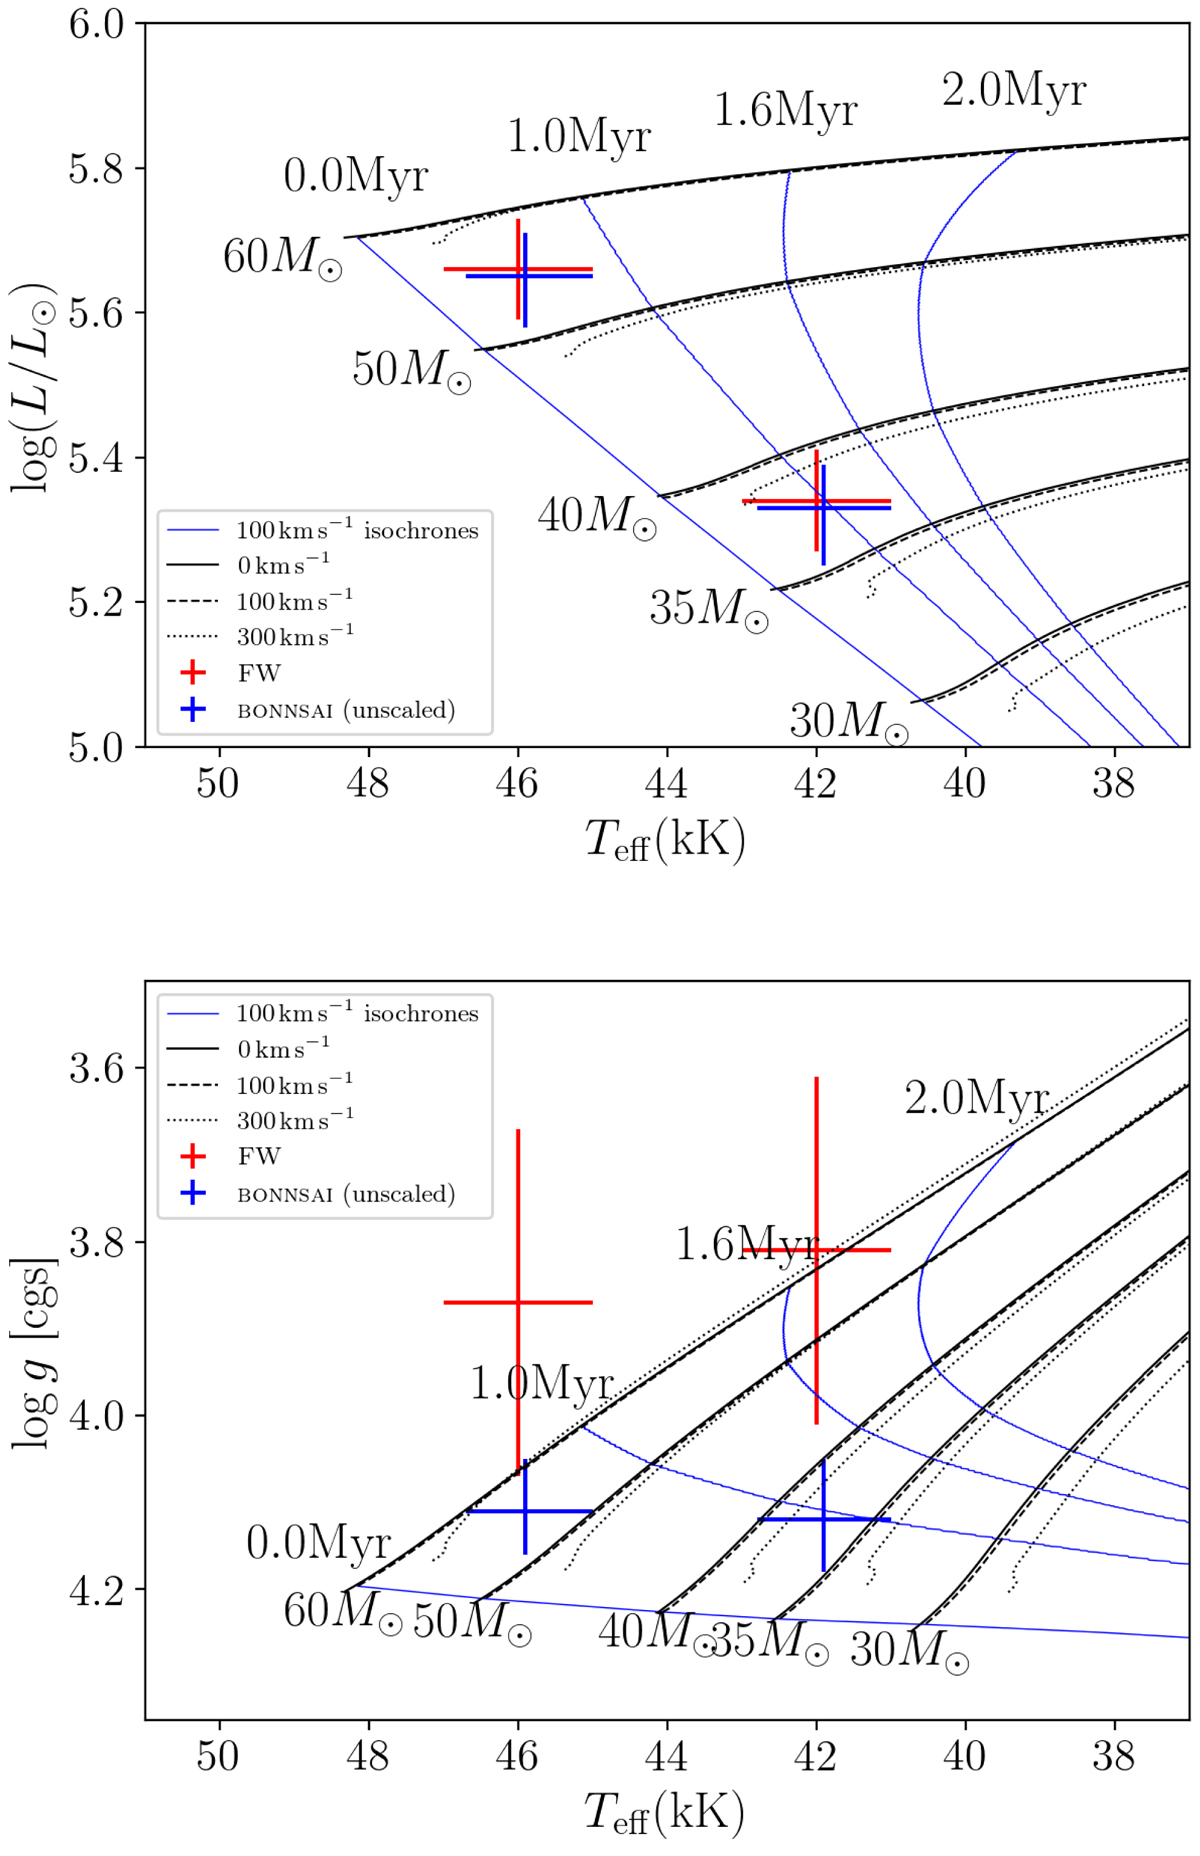
Top: Hertzsprung-Russell diagram, showing the location of the best-fit FASTWIND models (FW) and highest likelihood evolutionary models from Brott et al. (2011; BONNSAI). Overplotted are evolutionary tracks for different masses and initial rotation velocities (grey lines), along with isochrones for the 100 km s−1 initial rotation velocity models (blue lines). Bottom: Kiel diagram with an equivalent legend as the HRD above. Using the scaled CNO abundances does not appreciably move the model of the primary in either diagram.
Current usage metrics show cumulative count of Article Views (full-text article views including HTML views, PDF and ePub downloads, according to the available data) and Abstracts Views on Vision4Press platform.
Data correspond to usage on the plateform after 2015. The current usage metrics is available 48-96 hours after online publication and is updated daily on week days.
Initial download of the metrics may take a while.