Fig. A.6.
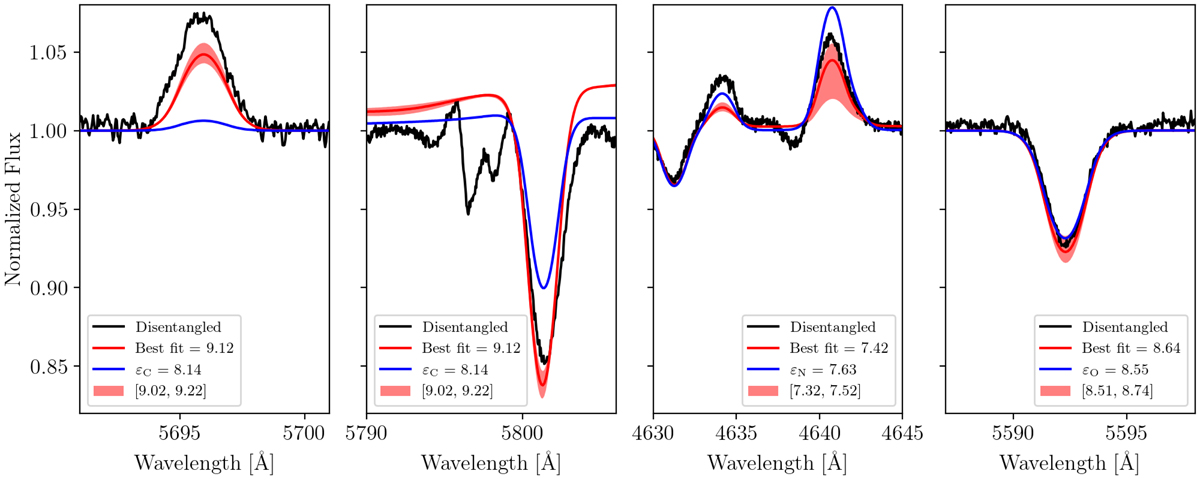
Comparison of the disentangled and best-fit model spectra of the secondary star with error ranges, along with a model spectrum having the Brott et al. (2011) CNO baseline abundances. From left to right, the lines C IIIλ 5696, C IVλ 5801, N IIIλλ 4634, 4641, and O III 5592 are shown, with a similar legend as Fig. A.5. The two leftmost panels argue for an elevated carbon abundance with respect to baseline, although as discussed in Sect. 4.2, the issues of C IIIλ 5696 prohibits making quantitative conclusions.
Current usage metrics show cumulative count of Article Views (full-text article views including HTML views, PDF and ePub downloads, according to the available data) and Abstracts Views on Vision4Press platform.
Data correspond to usage on the plateform after 2015. The current usage metrics is available 48-96 hours after online publication and is updated daily on week days.
Initial download of the metrics may take a while.