Fig. A.5.
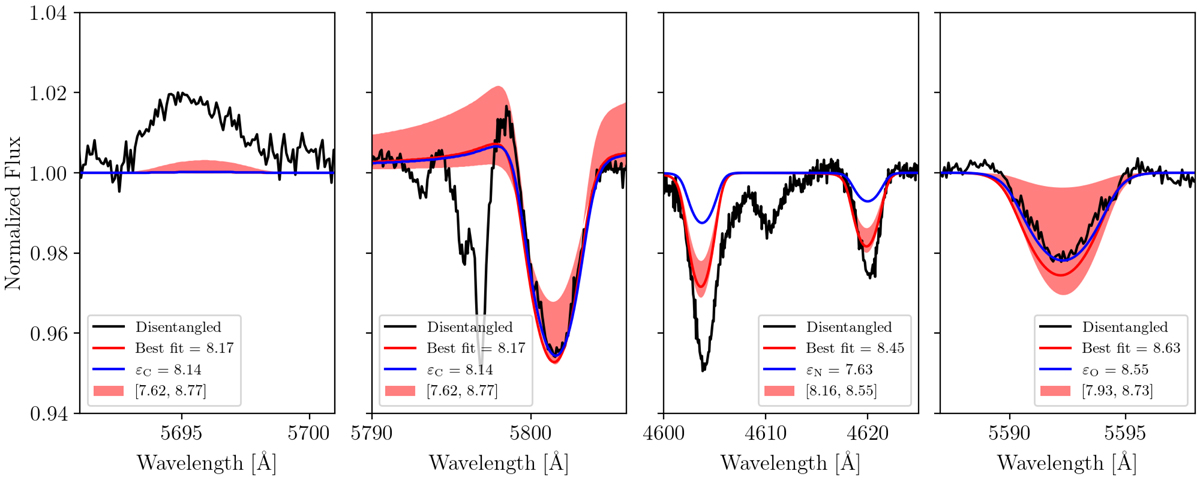
Comparison of the disentangled and best-fit model spectra of the primary star with error ranges, along with a model spectrum having the Brott et al. (2011) CNO baseline abundances. From left to right, the lines C IIIλ 5696, C IVλ 5801, N Vλλ 4604, 4620, and O III 5592 are shown, and the legend stipulates the respective CNO abundance values [X/H] + 12 and the baseline values εX. As these lines are the main abundance diagnostic for their respective CNO element, from the third panel it can be seen that there is evidence for significant nitrogen enrichment.
Current usage metrics show cumulative count of Article Views (full-text article views including HTML views, PDF and ePub downloads, according to the available data) and Abstracts Views on Vision4Press platform.
Data correspond to usage on the plateform after 2015. The current usage metrics is available 48-96 hours after online publication and is updated daily on week days.
Initial download of the metrics may take a while.