Fig. 1.
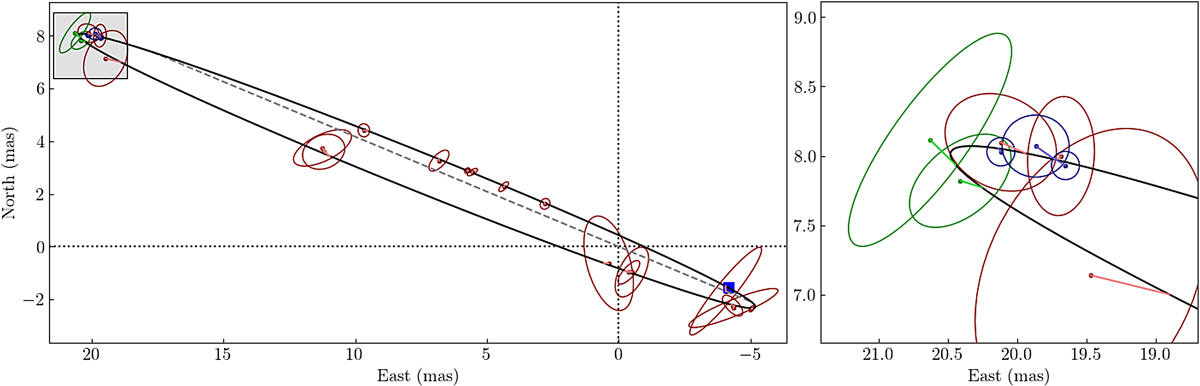
Relative astrometric orbit of 9 Sgr. Archival observations are denoted in red, the new PIONIER data in green, and the GRAVITY observations in blue, all with their respective error ellipses. The blue square indicates the periastron passage and the dashed line represents the line of nodes. The right panel shows the zoom-in of the shaded region.
Current usage metrics show cumulative count of Article Views (full-text article views including HTML views, PDF and ePub downloads, according to the available data) and Abstracts Views on Vision4Press platform.
Data correspond to usage on the plateform after 2015. The current usage metrics is available 48-96 hours after online publication and is updated daily on week days.
Initial download of the metrics may take a while.