Fig. E.1
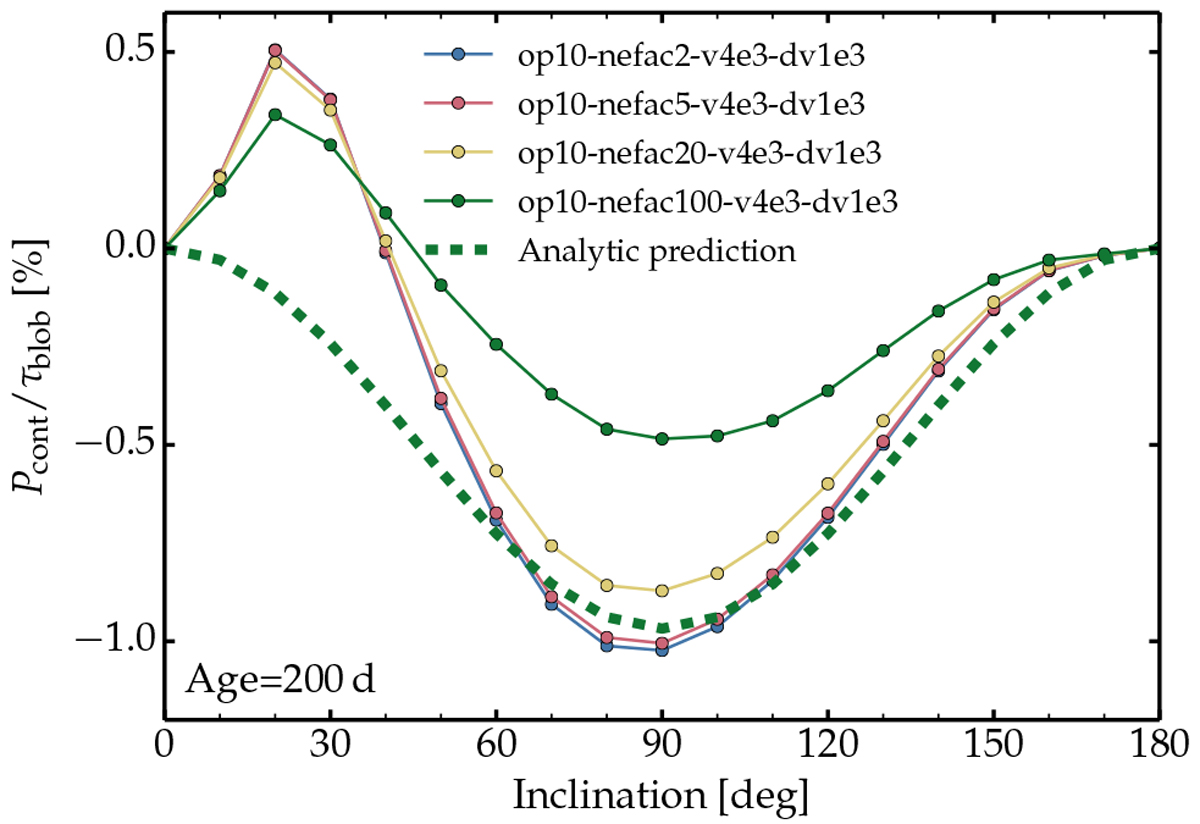
Illustration of the continuum polarization at 5000 Å normalized to the blob optical depth and shown forinclinations between zero and 180 deg, with the model aged to 200 d. The simulations are characterized by various values of the electron density enhancement associated with the blob (see label; the corresponding blob radial optical depth increases from 0.044, to 0.109, 0.436, and 2.178 for increasing Ne,fac). The dashed curve shows the prediction of Brown & McLean (1977), scaled by a factor of 0.75, using the characteristics of model op10-nefac100-v4e3-dv1e3 (green curve).
Current usage metrics show cumulative count of Article Views (full-text article views including HTML views, PDF and ePub downloads, according to the available data) and Abstracts Views on Vision4Press platform.
Data correspond to usage on the plateform after 2015. The current usage metrics is available 48-96 hours after online publication and is updated daily on week days.
Initial download of the metrics may take a while.