Fig. 14
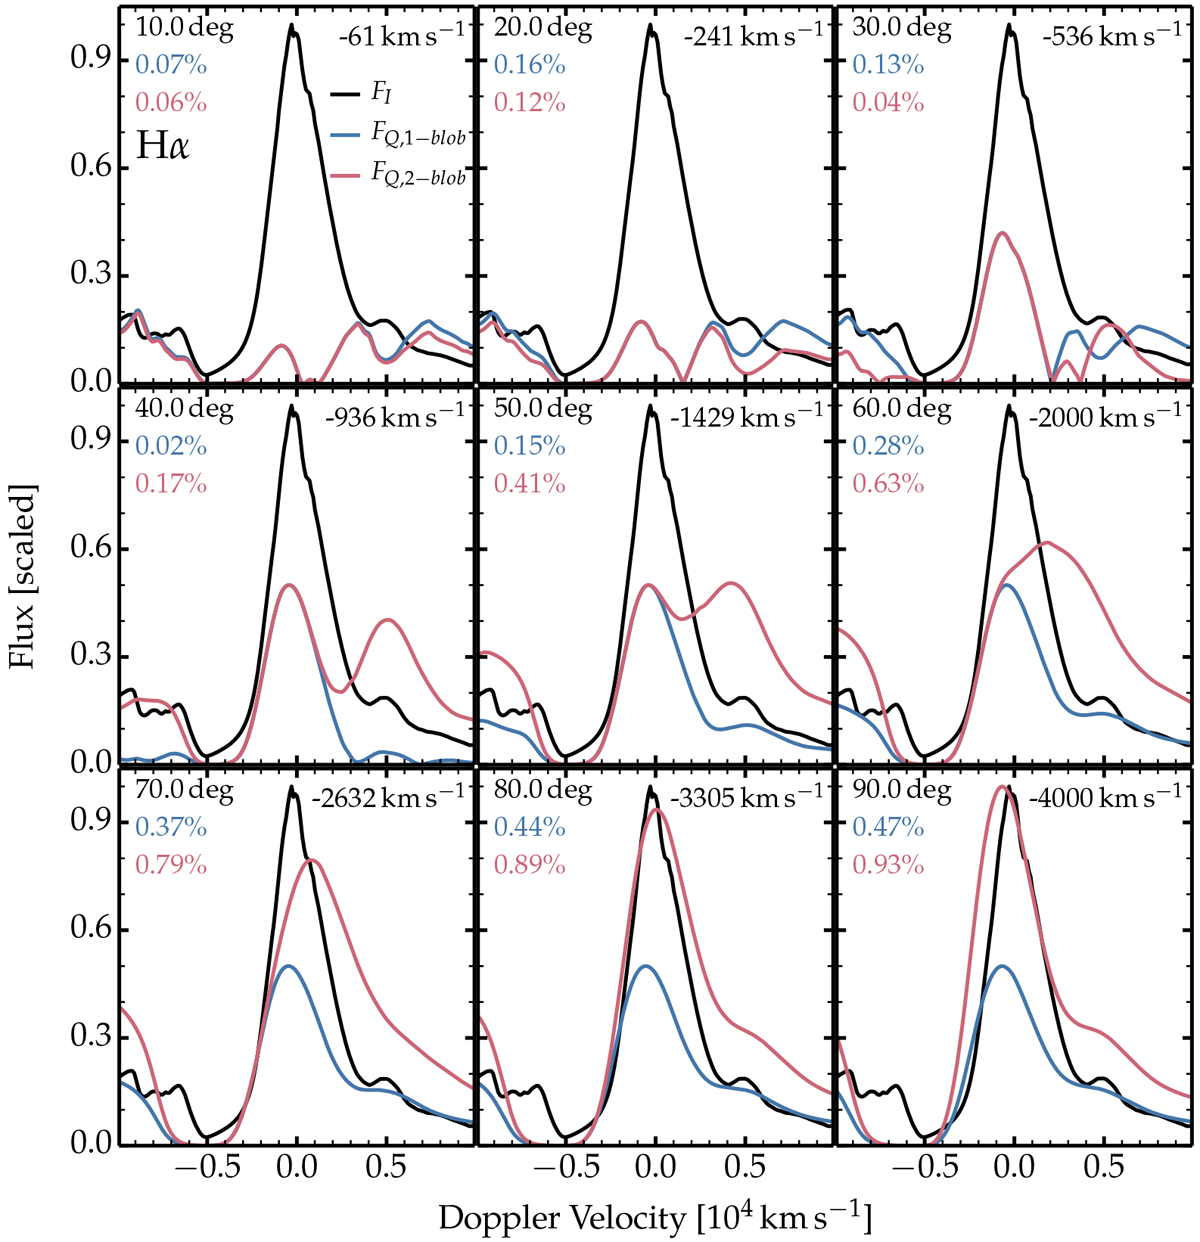
Same models as in Fig. 13, but now showing the evolution of the normalized total flux FI and scaled, blueshifted polarized flux |FQ| in the Hα region (zero Doppler velocity corresponds to the line rest wavelength) as a function of the inclination (progressing clockwise from 10 to 90 deg; the value of the inclination is given at the top left of each panel). The flux FQ,1−blob corresponds to the single-blob case in which a blob is placed along the symmetry axis and the computation is done over 180 deg in latitudes (no mirror symmetry). In contrast, the flux FQ,2−blob corresponds to the case in which a blob is placed along the symmetry axis but the simulation is carried over from 0 to 90 deg in latitude and assuming mirror symmetry – this is then equivalent to having two blobs180 deg apart. The value of the blueshift is the same for each polarized flux and set to − Vblob(1 − cosαlos), where αlos is the inclination of the single blob in the 1-blob case, and of the approaching blob in the 2-blob case. We use the same scaling of |FQ| for both models, so that the difference in polarization level between the two models is preserved (the continuum polarization in the 8000 Å region is given at the top left of each panel, below the value of the inclination). The enhancement is characterized in all cases by Vblob = 4000 km s−1, δVblob = 1000 km s−1, β = 10 deg, and Ne,fac = 20, corresponding to a radial blob optical depth of 0.436.
Current usage metrics show cumulative count of Article Views (full-text article views including HTML views, PDF and ePub downloads, according to the available data) and Abstracts Views on Vision4Press platform.
Data correspond to usage on the plateform after 2015. The current usage metrics is available 48-96 hours after online publication and is updated daily on week days.
Initial download of the metrics may take a while.