Fig. 9.
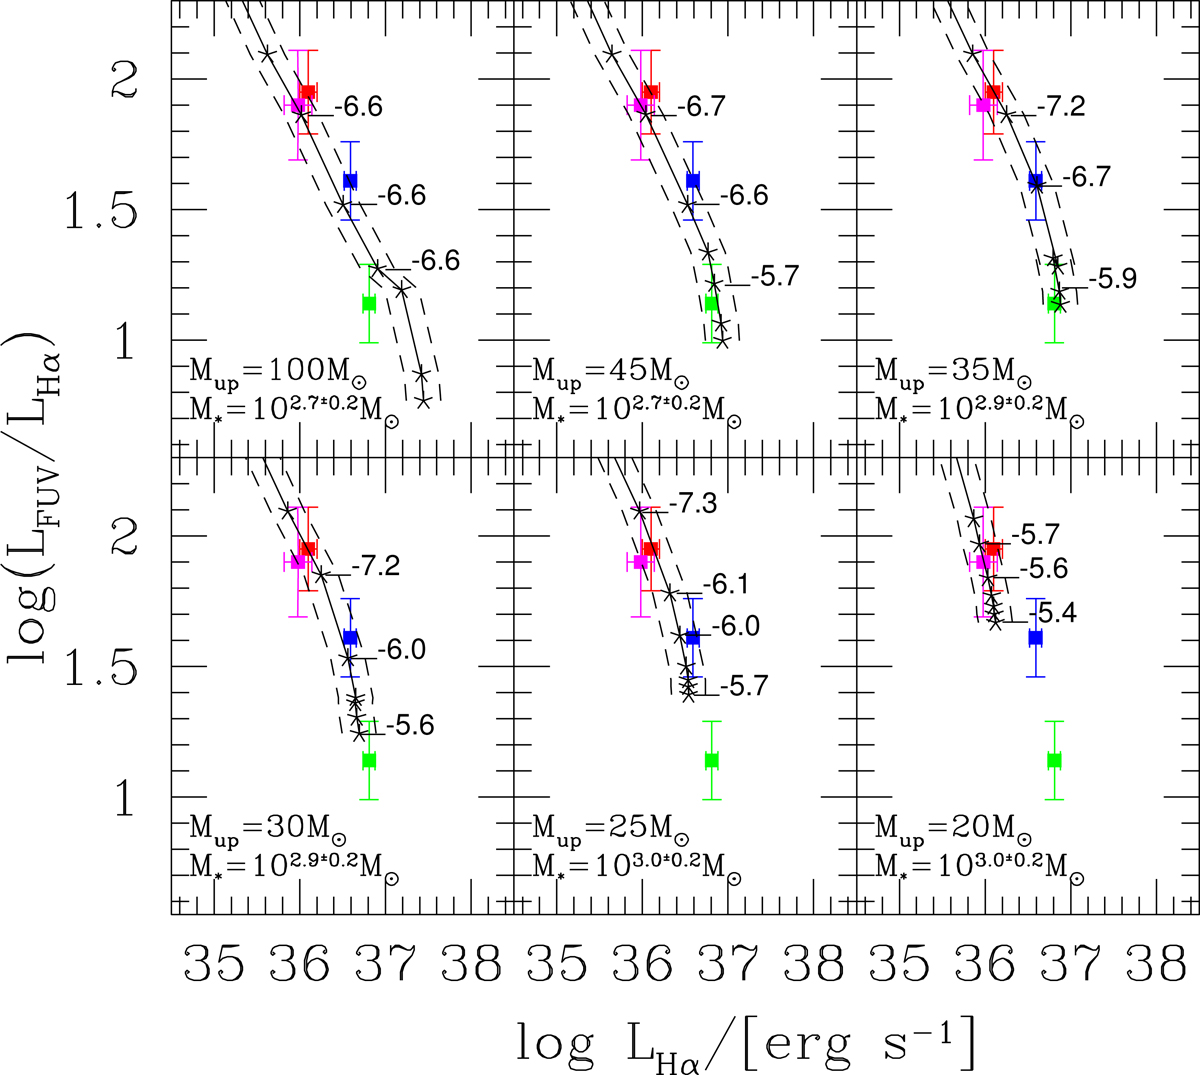
Time evolution of extinction corrected total Hα luminosity of the regions as a function of FUV/Hα luminosity ratio. The continuous line in each panel refer to a solar metallicity burst model with stellar mass and IMF upper end mass cut-off as indicated by M* and Mup. Time increases from bottom to top along the curves with asterisks marking time steps of 1 Myr from 1 to 7 Myr. The M* value in each panel has been chosen to best match the evolutionary model with the data, dashed lines indicate model predictions for 0.2 dex variations in M*. Some theoretical values of absolute visual magnitudes during cluster evolution are printed to the right of the horizontal tick marks indicating the time step. The extinction-corrected value of FUV/Hα luminosity ratio for the 4 H II regions, color coded as in Fig. 3, is plotted with filled squares and is measured in circular apertures with a 3.8″ radius.
Current usage metrics show cumulative count of Article Views (full-text article views including HTML views, PDF and ePub downloads, according to the available data) and Abstracts Views on Vision4Press platform.
Data correspond to usage on the plateform after 2015. The current usage metrics is available 48-96 hours after online publication and is updated daily on week days.
Initial download of the metrics may take a while.