Fig. 8.
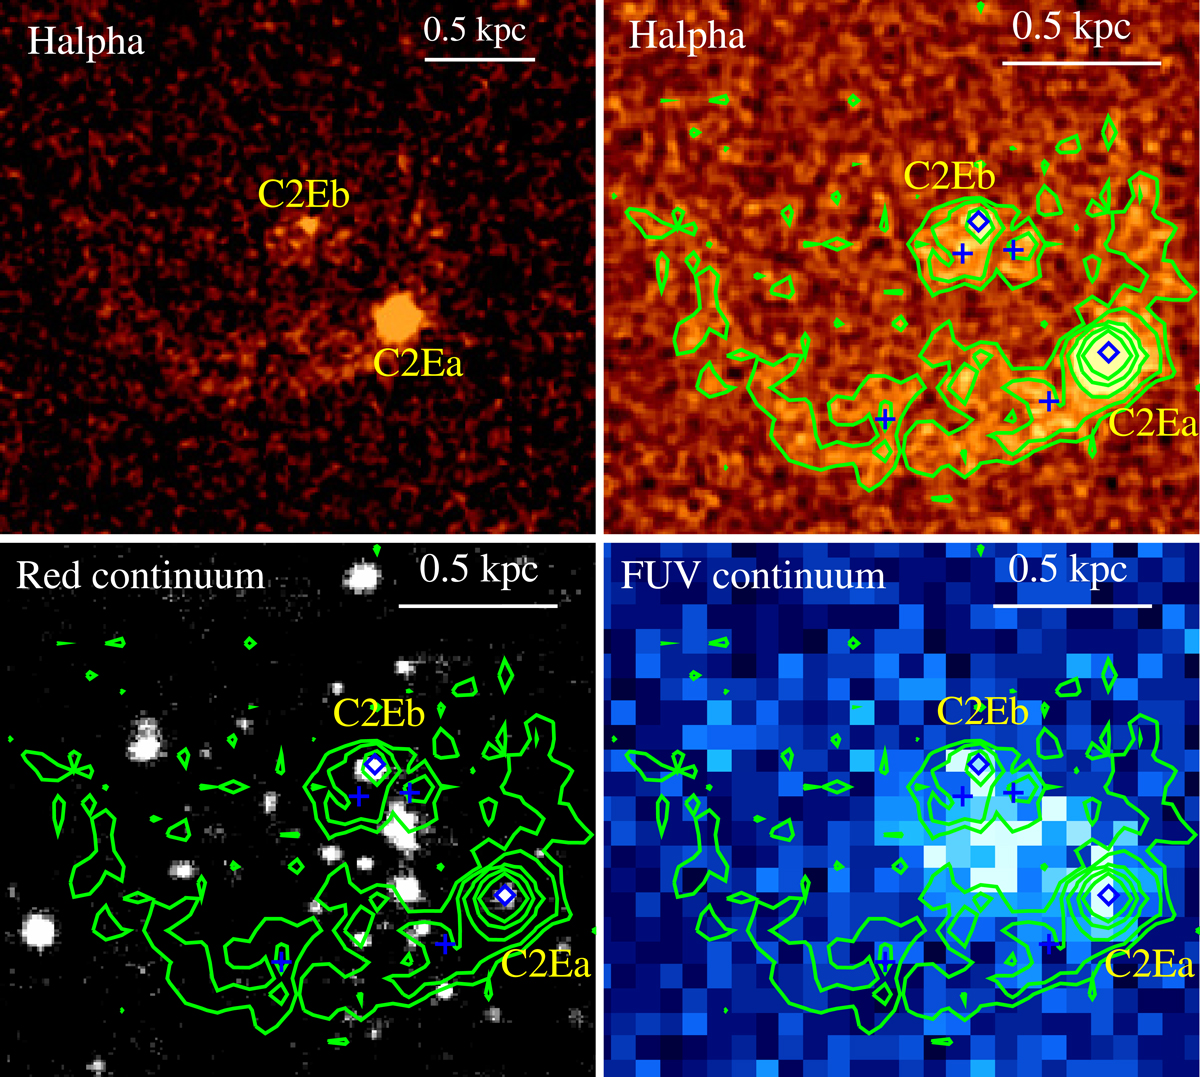
Image of Clump2E in Hα (log scale) is shown in the upper-left panel. The two brightest H II regions, with more than one nebular line detected, are marked with blue diamonds in a zoom in image of the Hα emission in the upper-right panel (linear scale). The Hα smoothed contour levels at 1.2, 2, 4, 10, 20 × 10−20 erg s−1 cm−2 per pixel shape a partial ring of radius ∼0.6 kpc. They are marked also on the VLT red continuum image (bottom-left panel) and on the FUV-GALEX image (bottom-right panel). The blue crosses, at the location of the Hα sources listed in Table 3, are some examples of the marginally detected faint Hα emitters with no optical counterpart.
Current usage metrics show cumulative count of Article Views (full-text article views including HTML views, PDF and ePub downloads, according to the available data) and Abstracts Views on Vision4Press platform.
Data correspond to usage on the plateform after 2015. The current usage metrics is available 48-96 hours after online publication and is updated daily on week days.
Initial download of the metrics may take a while.