Fig. 7.
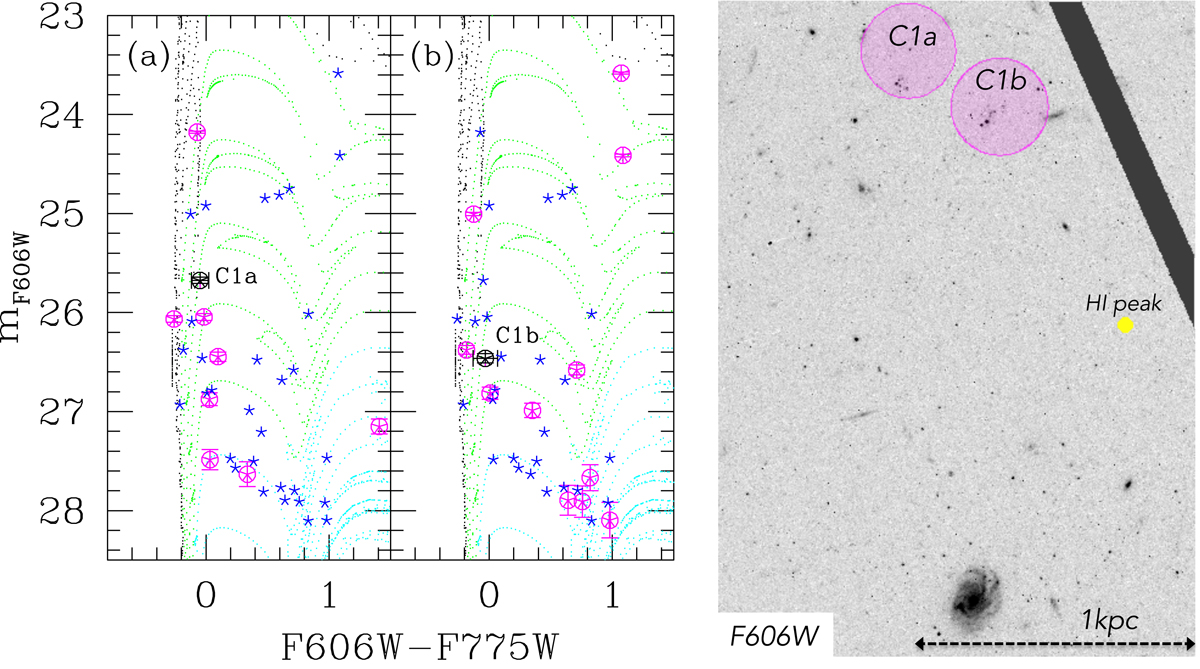
Point-like sources within 1 kpc of the center of the area hosting the two brightest nebulae in Clump1 are shown with asterisk symbols in the CMD (in VEGAMAGS) of panels a and b. The open magenta circles mark sources within 3.8″ from the center of C1a in panel a and of C1b in panel b, with black color and labels used for sources at the center of the nebulae. The dotted lines are the predicted evolutionary tracks for PADOVA isochrones for Z = 0.0142, with black color for ages ≤ 10 Myr, green color for ages between 10 and 100 Myr and cyan color for ages ≥ 100 Myr. No extinction corrections have been applied. To the right the HST-F606W image shows the sparse population of stars in a region of Clump1. Magenta circles of 3.8″ radii have been placed at the location of C1a and C1b, a filled yellow dot indicates the HI peak of Clump1. For reference the dashed line is 1 kpc in length.
Current usage metrics show cumulative count of Article Views (full-text article views including HTML views, PDF and ePub downloads, according to the available data) and Abstracts Views on Vision4Press platform.
Data correspond to usage on the plateform after 2015. The current usage metrics is available 48-96 hours after online publication and is updated daily on week days.
Initial download of the metrics may take a while.