Fig. 6.
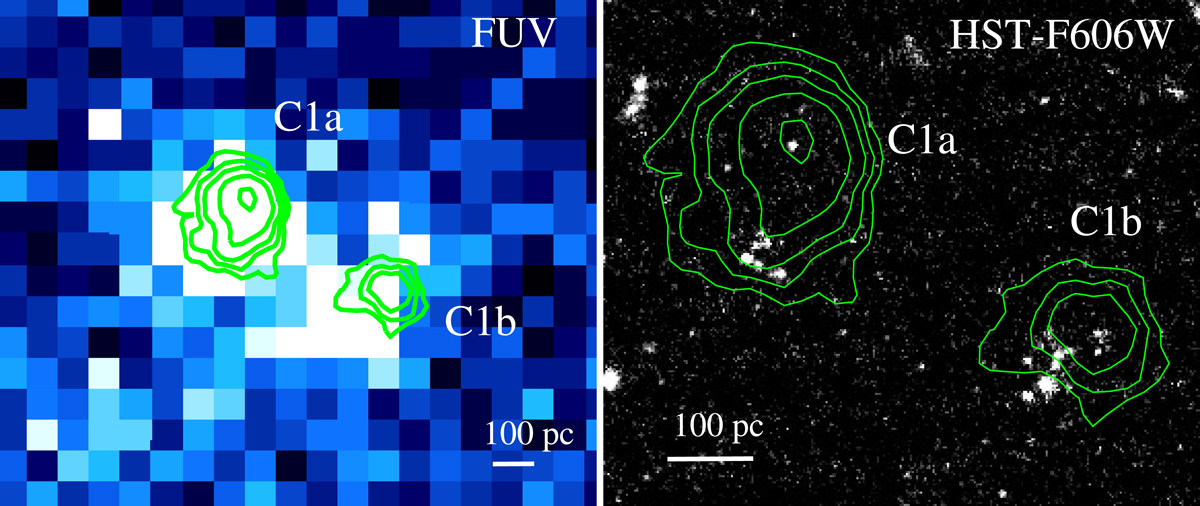
Contours of the Hα emission of the two brightest H II regions in Clump1, C1a, and C1b, are overplotted in green to the GALEX-FUV continuum image in the left panel and to the HST-ACS-F606W optical image in the right panel. Contour levels are: 2.5, 4, 6, 10, 20 × 10−20 erg s−1 cm−2 per pixel (0.2″). The radius of the 10 × 10−20 erg s−1 cm−2 contour level is about 70 and 50 pc for C1a and C1b respectively. The HST image shows that only part of the stellar population in the cloud is emitting ionizing photons powering the Strömgren spheres.
Current usage metrics show cumulative count of Article Views (full-text article views including HTML views, PDF and ePub downloads, according to the available data) and Abstracts Views on Vision4Press platform.
Data correspond to usage on the plateform after 2015. The current usage metrics is available 48-96 hours after online publication and is updated daily on week days.
Initial download of the metrics may take a while.