Fig. 3.
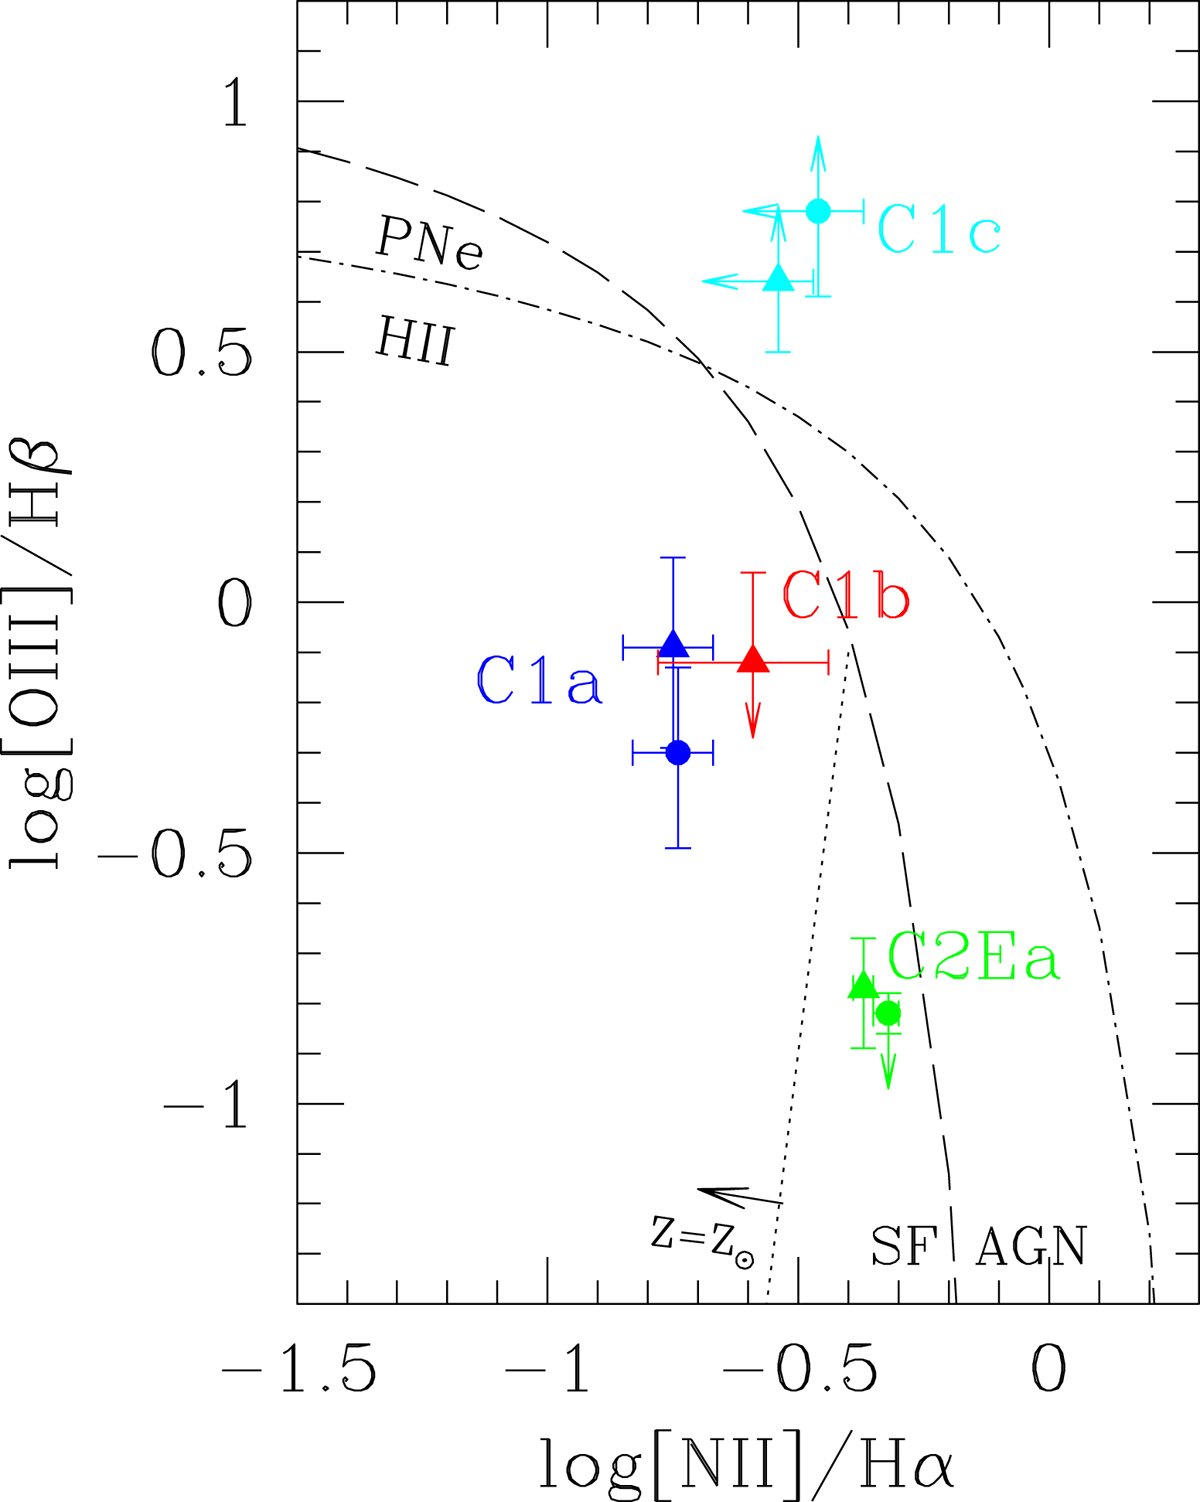
Line ratios [OIII]5007/Hβ and [NII]6586/Hα are plotted for all nebular regions in Table 1 for which these ratios have been measured or limiting values can be inferred. Different colors indicate different regions. Data for the largest aperture (radius 2.4″) has been plotted with a filled circle and are listed in Table 2, filled triangles refer to 1.2″ apertures. For reference, we also indicate the criteria proposed by Kauffmann et al. (2003) for distinguishing between star forming galaxies and AGN (dashed line) and by Sanders et al. (2012) to separate H II regions and PNe (dash-dotted line). All H II region evolutionary models of Pellegrini et al. (2020) at Z = Z⊙ fall to the left of the dotted line. The [NII]6586 line is undetected in C1c and the [OIII]5007 line is undetected in C1b.
Current usage metrics show cumulative count of Article Views (full-text article views including HTML views, PDF and ePub downloads, according to the available data) and Abstracts Views on Vision4Press platform.
Data correspond to usage on the plateform after 2015. The current usage metrics is available 48-96 hours after online publication and is updated daily on week days.
Initial download of the metrics may take a while.