Fig. 2.
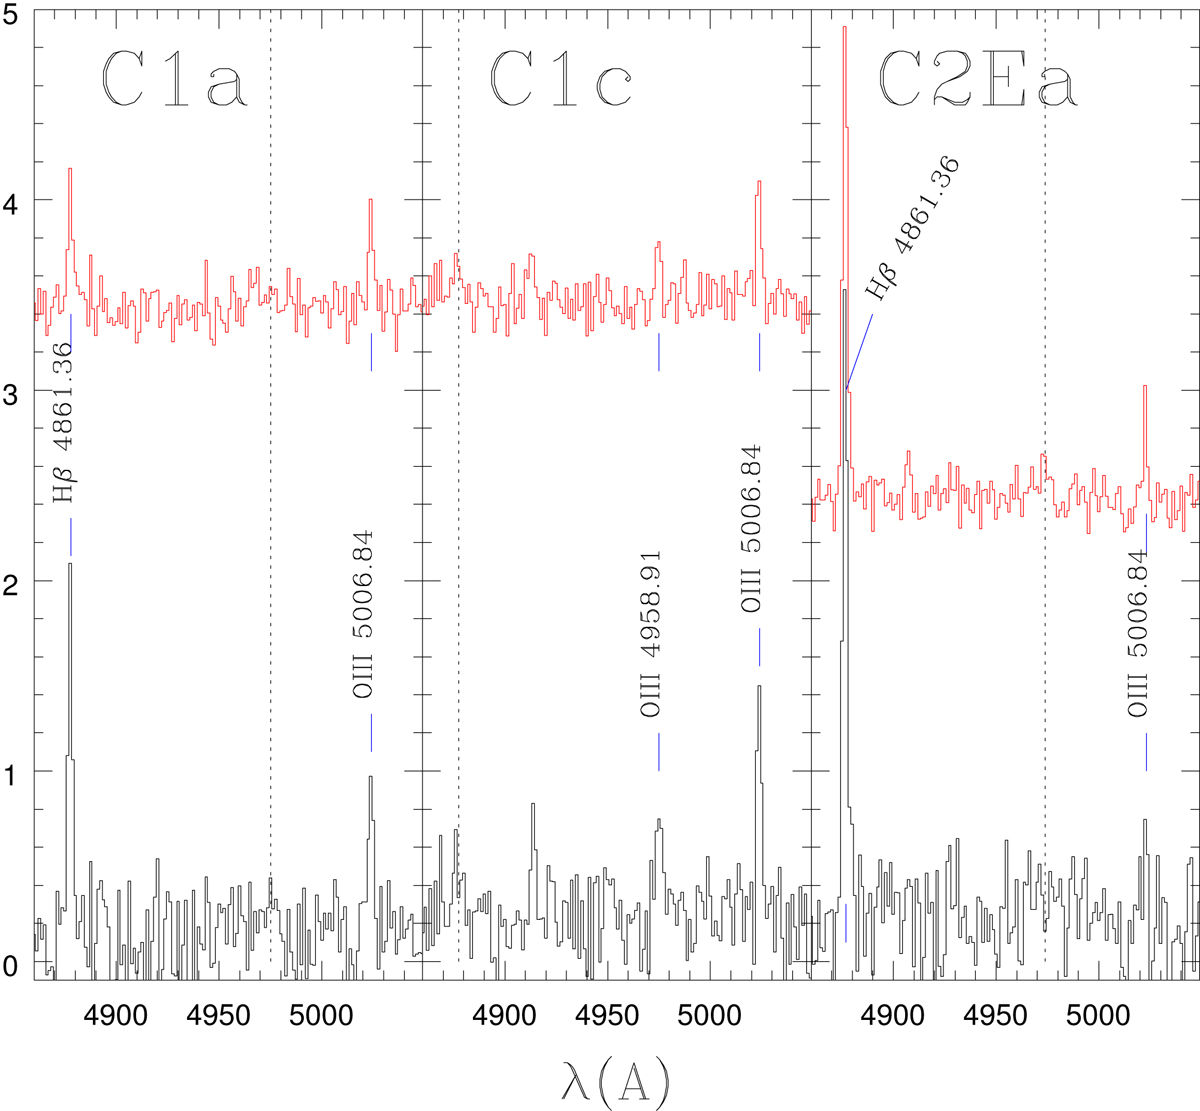
Detected and undetected nebular line emission in the blue portions of the spectra for three regions of the Leo ring. Apertures have radii of 2.4″ (black lines) and of 1.2″ (red lines). Emission lines detected at least in one aperture are labeled with the rest frame wavelengths and blue tick marks. Dotted lines for undetected lines are placed at the expected wavelengths. Line intensity units along the y-axis are 10−17 erg s−1 cm−2 Å−1. Spectra have been arbitrarily shifted along the y-axes for display purposes.
Current usage metrics show cumulative count of Article Views (full-text article views including HTML views, PDF and ePub downloads, according to the available data) and Abstracts Views on Vision4Press platform.
Data correspond to usage on the plateform after 2015. The current usage metrics is available 48-96 hours after online publication and is updated daily on week days.
Initial download of the metrics may take a while.