Fig. 1.
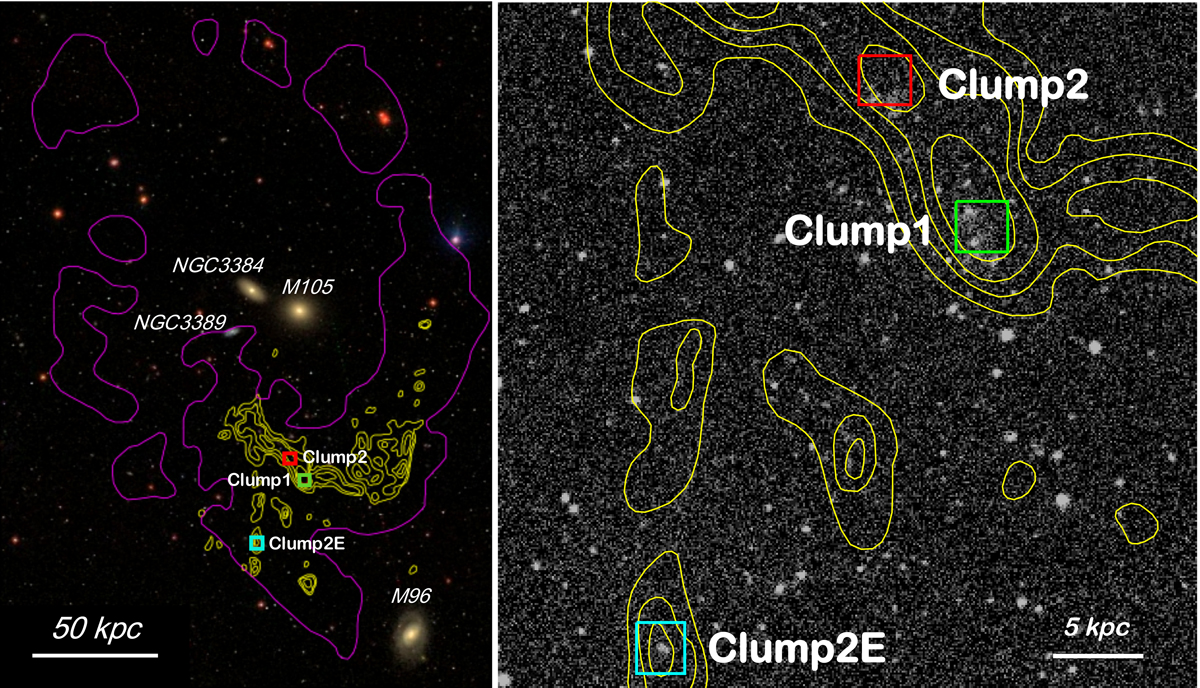
Optical image of the M 96 group in the background (SDSS color image) is shown in the left panel with H I contours of the Leo ring. In magenta, we show the Arecibo contour at NHI = 2 × 1018 cm−2, in yellow the VLA H I contours of the southern part of the ring as described by Schneider et al. (1986). Square symbols indicate the positions of the 3 H I clumps observed with MUSE: Clump1, Clump2, and Clump2E. Right panel: an enlargement of the 3 H I clumps shows the coverage of the 8.5 kpc2 MUSE fields overlaid on the far UV-GALEX image.
Current usage metrics show cumulative count of Article Views (full-text article views including HTML views, PDF and ePub downloads, according to the available data) and Abstracts Views on Vision4Press platform.
Data correspond to usage on the plateform after 2015. The current usage metrics is available 48-96 hours after online publication and is updated daily on week days.
Initial download of the metrics may take a while.