Fig. 8.
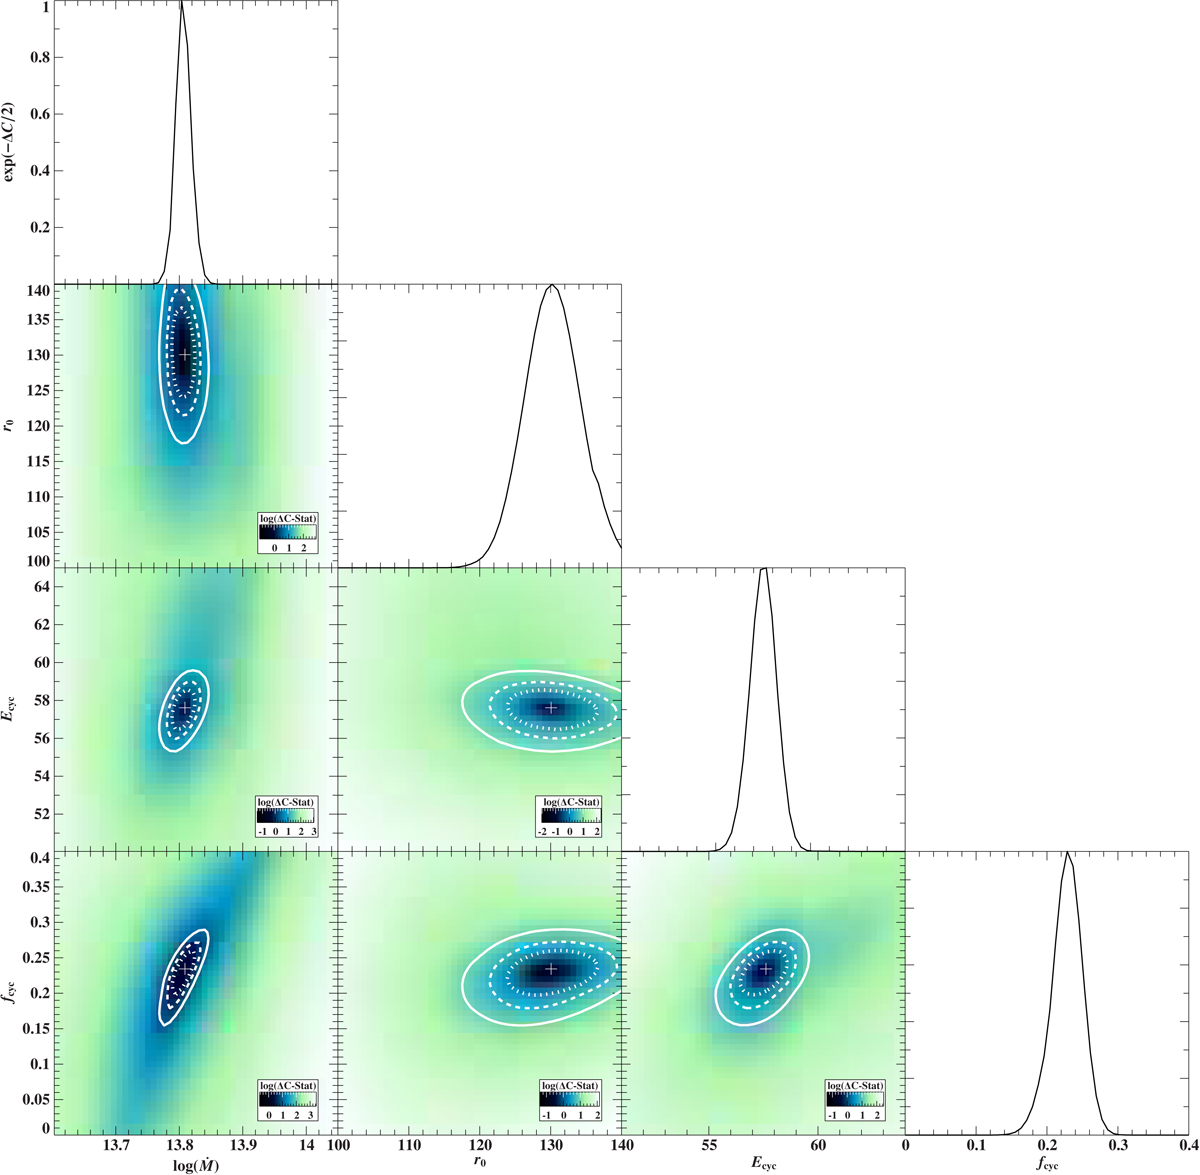
Parameter probabilities for the polcap model applied to the low-luminosity observation of GX 304−1. Correlations for different parameters are shown in color as two-dimensional confidence maps, where dotted, dashed, and solid contours correspond to the 99%, 90%, and 68% confidence regions, respectively. Here “ΔC-Stat” represents the statistic change compared to the best fit. Side panels on the right show the one-dimensional parameter probabilities.
Current usage metrics show cumulative count of Article Views (full-text article views including HTML views, PDF and ePub downloads, according to the available data) and Abstracts Views on Vision4Press platform.
Data correspond to usage on the plateform after 2015. The current usage metrics is available 48-96 hours after online publication and is updated daily on week days.
Initial download of the metrics may take a while.