Free Access
Fig. 4
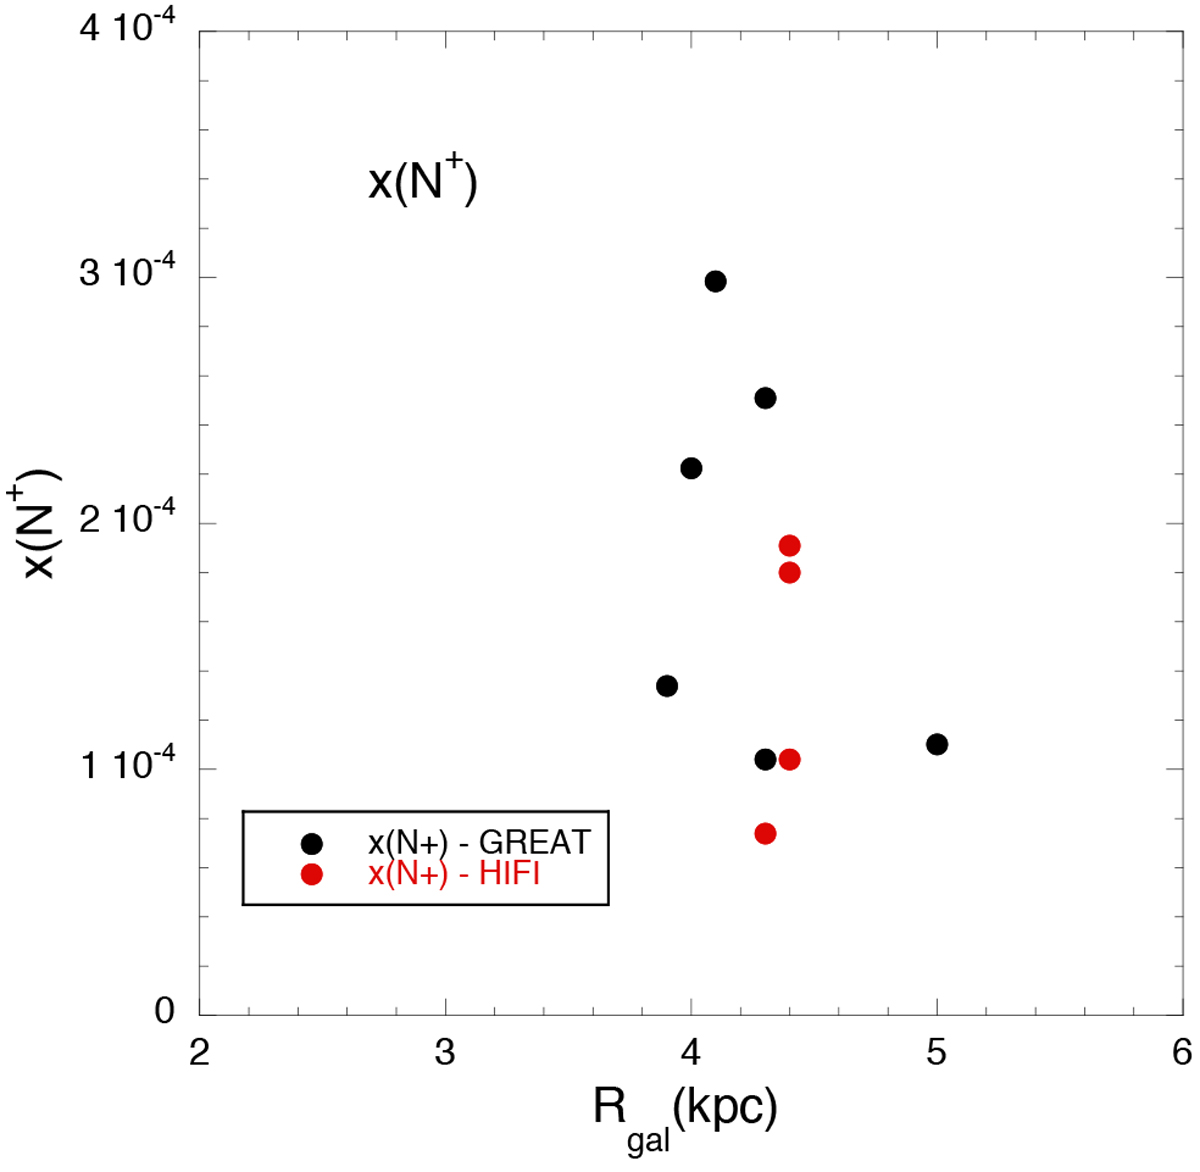
Fractional abundance of N+, x(N+), derived from [N II] and the RRL emission lines. The values derived from GREAT are shown in black, while those from HIFI (in Table 3 Pineda et al. 2019) that are at the same Galactic latitude are plotted in red.
Current usage metrics show cumulative count of Article Views (full-text article views including HTML views, PDF and ePub downloads, according to the available data) and Abstracts Views on Vision4Press platform.
Data correspond to usage on the plateform after 2015. The current usage metrics is available 48-96 hours after online publication and is updated daily on week days.
Initial download of the metrics may take a while.