Free Access
Fig. A.2
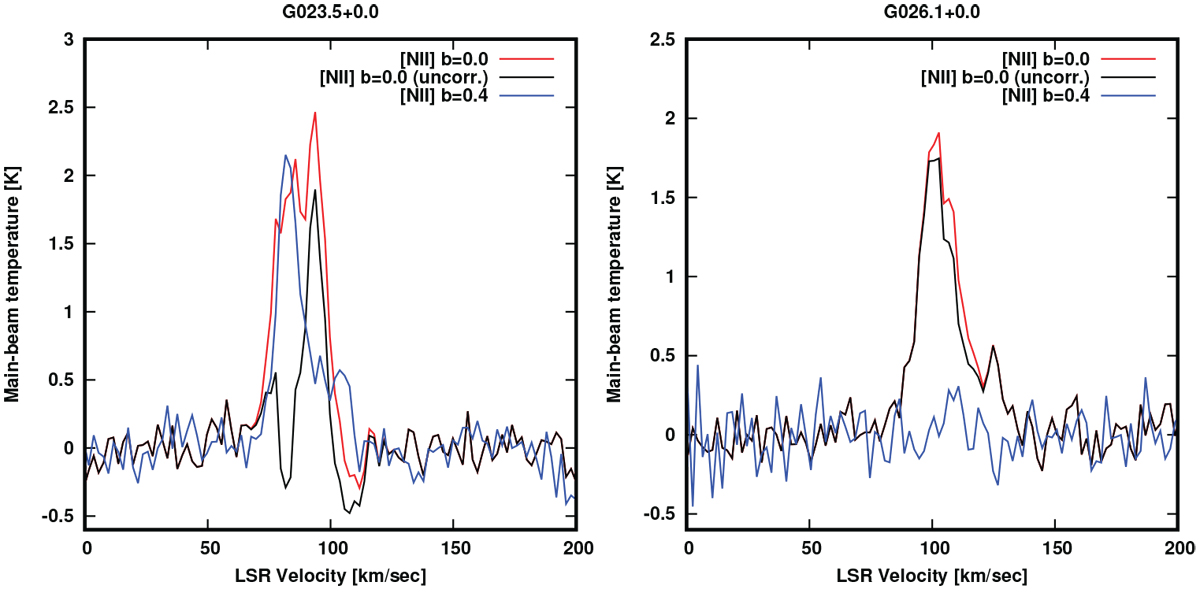
Main beam temperature, Tmb (K), versus velocity for [N II] for two of the four LOS where we had to correct the spectra for emission in the OFF position at b = 0.°4. The black line is the uncorrected spectrum at b = 0.°0, the blue line is the emission at b = 0.°4, and the red line is the corrected spectrum at b = 0.°0.
Current usage metrics show cumulative count of Article Views (full-text article views including HTML views, PDF and ePub downloads, according to the available data) and Abstracts Views on Vision4Press platform.
Data correspond to usage on the plateform after 2015. The current usage metrics is available 48-96 hours after online publication and is updated daily on week days.
Initial download of the metrics may take a while.