Fig. 1
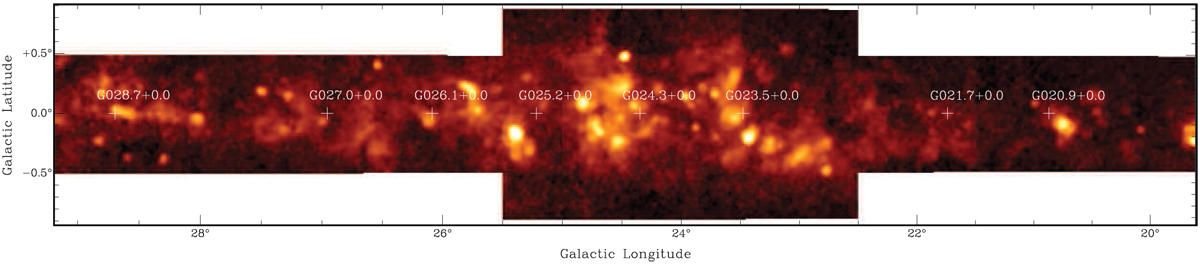
Location of the eight LOSs observed in [N II], RRL, and [C II], indicated + signs, superimposed on a moment 0 integrated intensity map of the Hnα RRL GBT Diffuse Ionized Gas Survey (GDIG; Anderson et al. 2021). None of the LOS intersect the locations of the brightest compact emission, although many intersect larger ionized zones.
Current usage metrics show cumulative count of Article Views (full-text article views including HTML views, PDF and ePub downloads, according to the available data) and Abstracts Views on Vision4Press platform.
Data correspond to usage on the plateform after 2015. The current usage metrics is available 48-96 hours after online publication and is updated daily on week days.
Initial download of the metrics may take a while.