Open Access
Fig. 6.
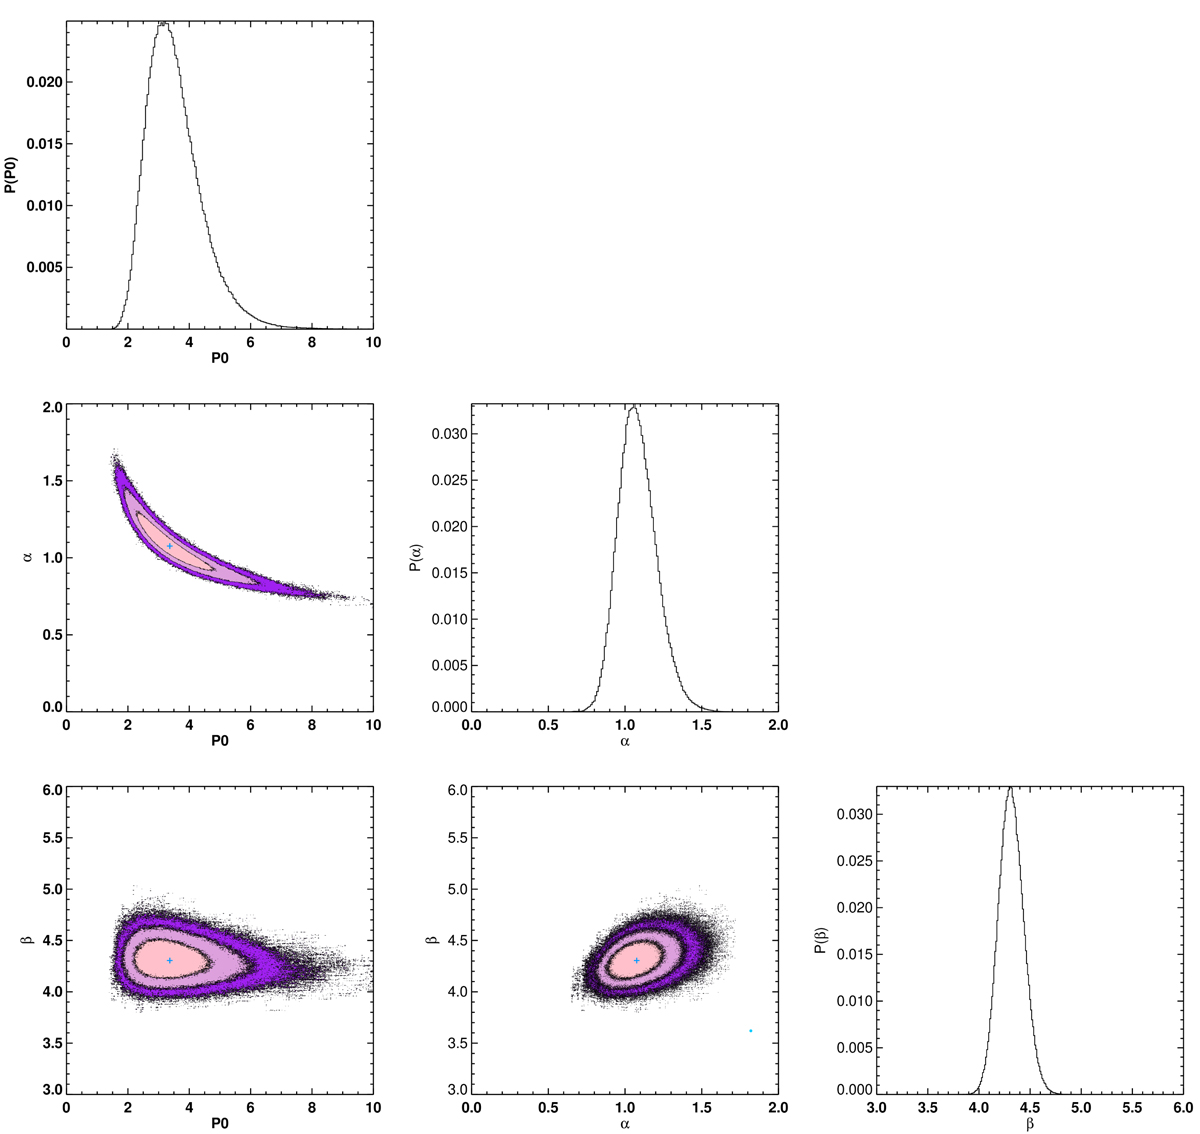
Posterior probability distributions and heat maps corresponding to our MCMC fit to a gGNFW pressure profile (see Sect. 5.2). The blue crosses in the 2D heat maps show the optimal solution reported in Table 3. The colour filled area show the locus of the 68, 95 and 99.7% confidence levels, respectively.
Current usage metrics show cumulative count of Article Views (full-text article views including HTML views, PDF and ePub downloads, according to the available data) and Abstracts Views on Vision4Press platform.
Data correspond to usage on the plateform after 2015. The current usage metrics is available 48-96 hours after online publication and is updated daily on week days.
Initial download of the metrics may take a while.