Fig. 5.
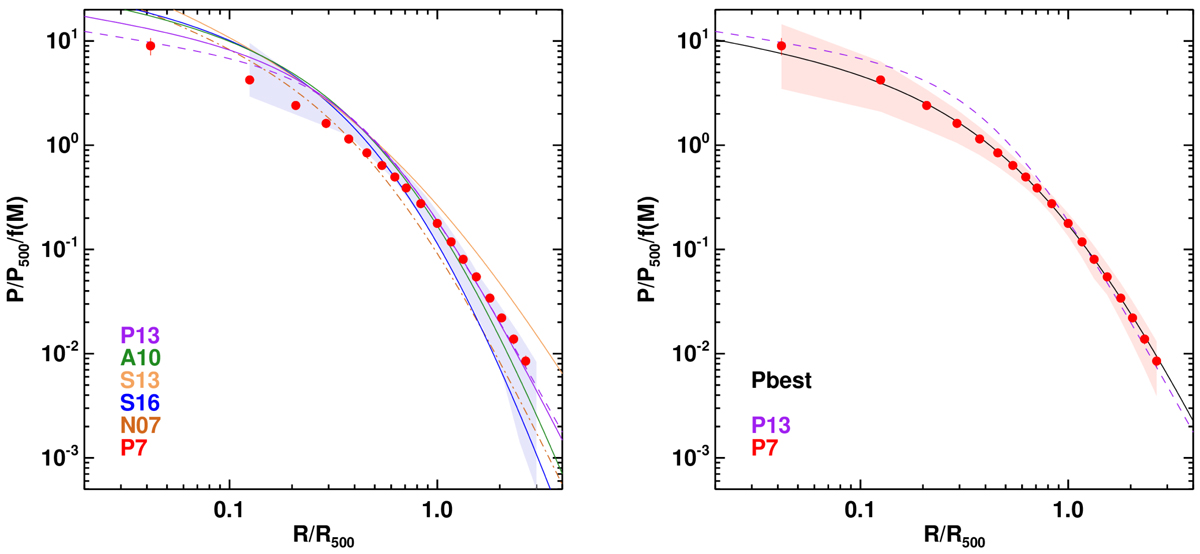
Stacked average pressure profiles over the PACT31 sample (red points). The reported errors bars on the data points are correlated and correspond to the square root of the diagonal valued of the covariance matrix for the pressure profile Left: comparison to published profiles over different samples by (A10; P13; Sayers et al. 2013, 2016) are overlaid as green, purple, yellow and blue lines and labelled as A10, P13, S13 and S16, respectively. The brown doted-dashed line, labelled N07, shows the original parametrisation from Nagai et al. (2007). For the P13 profiles, the solid and dashed lines correspond to the best fit to the whole PLCK62 sample and the non cool-core sub-sample, respectively. The purple shaded area picture the dispersion of the stacked Planck profiles for the PLCK62 sample (as published by P13, their Fig. 4). Right: best fit of our data to a gNFW pressure distribution (solid black line – see Table 3 and Sect. 5.2). The red shaded area shows the dispersion of the stacked profiles for the PACT31 sample. The dashed purple solid line is identical to the left panel.
Current usage metrics show cumulative count of Article Views (full-text article views including HTML views, PDF and ePub downloads, according to the available data) and Abstracts Views on Vision4Press platform.
Data correspond to usage on the plateform after 2015. The current usage metrics is available 48-96 hours after online publication and is updated daily on week days.
Initial download of the metrics may take a while.