Fig. 2.
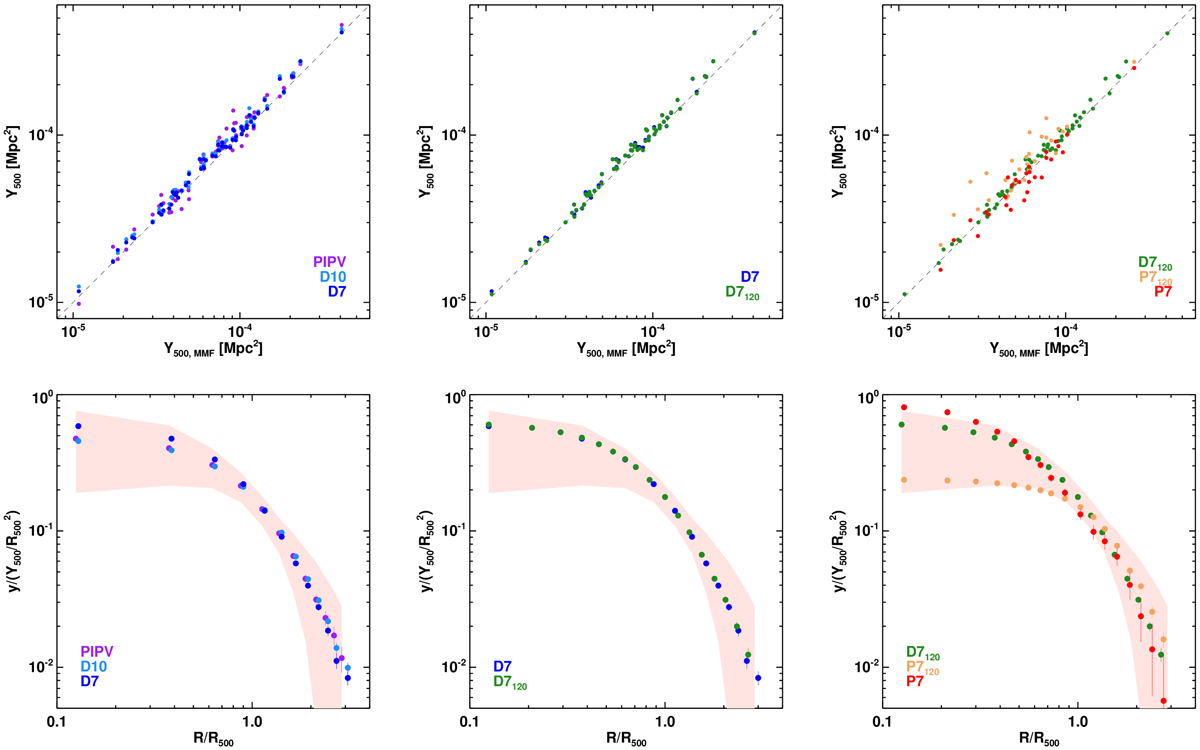
Top-row: one-to-one comparison of the integrated SZ flux, Y500, using as reference x-axis values fluxes computed from the PACT maps as presented in Aghanim et al. (2019). Bottom-row: average stacked y profiles in units of R500 and ![]() . Columns present the various steps of validation: left-column: check of Planck dataset version and y map resolution. Middle-column: check of the impact of the radial sampling factor δr. Right-column: comparison of profiles derived from Planck and PACT maps and samples. Labels in the legends are for the various test configurations as defined in Table 2 and discussed Sect. 4. For the three profile plots, the red shaded envelop is the same and corresponds to the 1σ dispersion across this same sample as published by P13 (left panel of their Fig. 3). We also adopted their radial range. The error bars correspond to the square root of the diagonal of the covariance matrix and therefore bear a certain degree of correlation between points.
. Columns present the various steps of validation: left-column: check of Planck dataset version and y map resolution. Middle-column: check of the impact of the radial sampling factor δr. Right-column: comparison of profiles derived from Planck and PACT maps and samples. Labels in the legends are for the various test configurations as defined in Table 2 and discussed Sect. 4. For the three profile plots, the red shaded envelop is the same and corresponds to the 1σ dispersion across this same sample as published by P13 (left panel of their Fig. 3). We also adopted their radial range. The error bars correspond to the square root of the diagonal of the covariance matrix and therefore bear a certain degree of correlation between points.
Current usage metrics show cumulative count of Article Views (full-text article views including HTML views, PDF and ePub downloads, according to the available data) and Abstracts Views on Vision4Press platform.
Data correspond to usage on the plateform after 2015. The current usage metrics is available 48-96 hours after online publication and is updated daily on week days.
Initial download of the metrics may take a while.