Fig. 1.
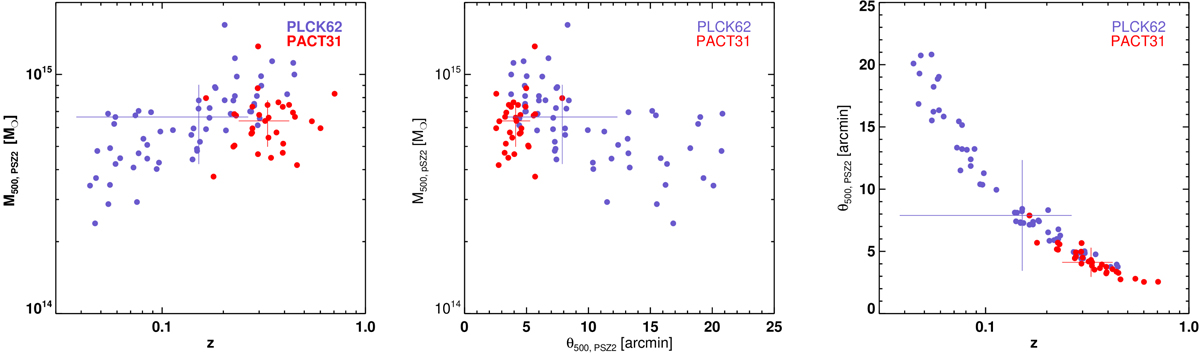
Distribution of the PACT31 (red dots) and PLCK62 (blue dots) in the M500 − z(left), M500 − θ500(middle) and θ500 − z(right). Crosses picture the median value and associated maximum absolute deviation over each sample. Values for the redshift, masses and angular radii are taken from the PSZ2 catalogue (Planck Collaboration XXVII 2016).
Current usage metrics show cumulative count of Article Views (full-text article views including HTML views, PDF and ePub downloads, according to the available data) and Abstracts Views on Vision4Press platform.
Data correspond to usage on the plateform after 2015. The current usage metrics is available 48-96 hours after online publication and is updated daily on week days.
Initial download of the metrics may take a while.