Fig. 9
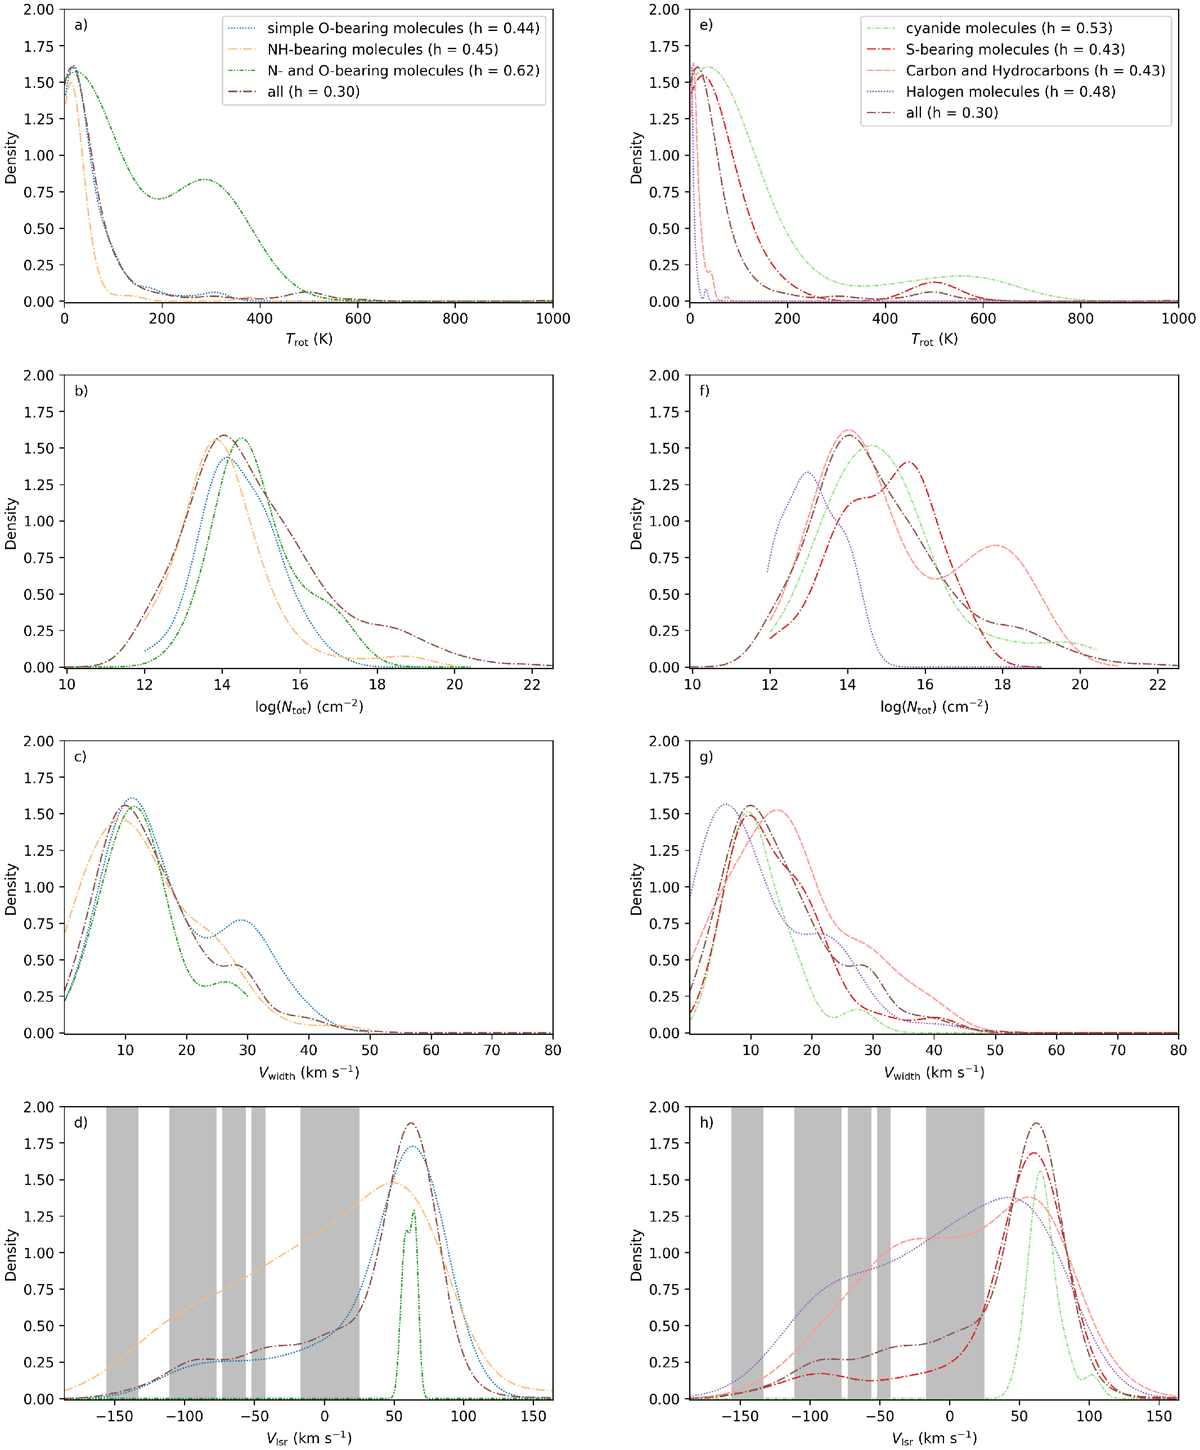
Normalized KDE for different model parameters and molecule families defined in Sect. 4. Additionally, the bandwidth h of all KDEs used for each molecule family is given as well. The gray areas in d indicate the velocity ranges described in Table 1. The families “complex O-bearing molecules” (Sect. 4.2) and “other molecules” (Sect. 4.9) are not shown, because they contain only one molecule, respectively.
Current usage metrics show cumulative count of Article Views (full-text article views including HTML views, PDF and ePub downloads, according to the available data) and Abstracts Views on Vision4Press platform.
Data correspond to usage on the plateform after 2015. The current usage metrics is available 48-96 hours after online publication and is updated daily on week days.
Initial download of the metrics may take a while.