Fig. 4
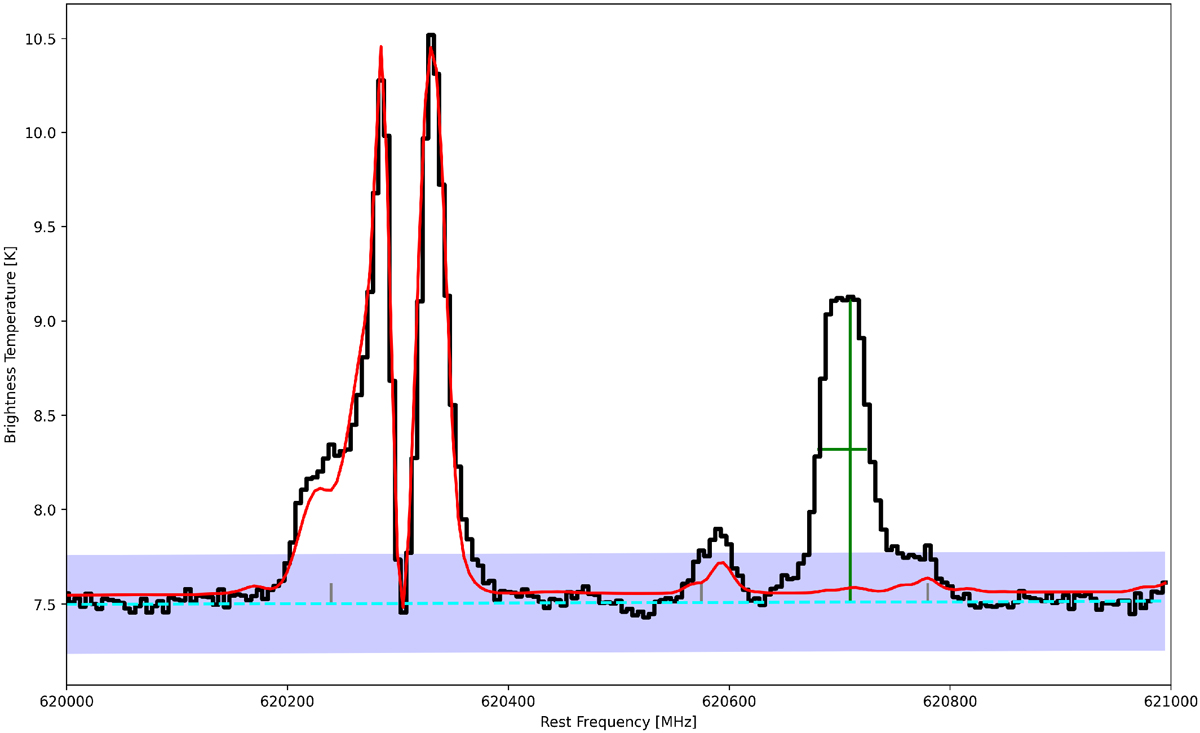
Example of unidentified peaks in the HIFI survey of Sgr B2(M) in band 1b. The observed spectrum is shown in black, the full model in red, and the cyan dashed line marks the continuum level. The blue area represents the + ∕−3σ level, i.e., all peaks that do not protrude from this area are ignored. The height and width of the unidentified feature near 620.7 GHZ is described by the horizontal and vertical green line, respectively. The peaks indicated by the small gray vertical lines are ignored, because their line widths are below the lower limit of the allowed range of line widths.
Current usage metrics show cumulative count of Article Views (full-text article views including HTML views, PDF and ePub downloads, according to the available data) and Abstracts Views on Vision4Press platform.
Data correspond to usage on the plateform after 2015. The current usage metrics is available 48-96 hours after online publication and is updated daily on week days.
Initial download of the metrics may take a while.