Fig. 3
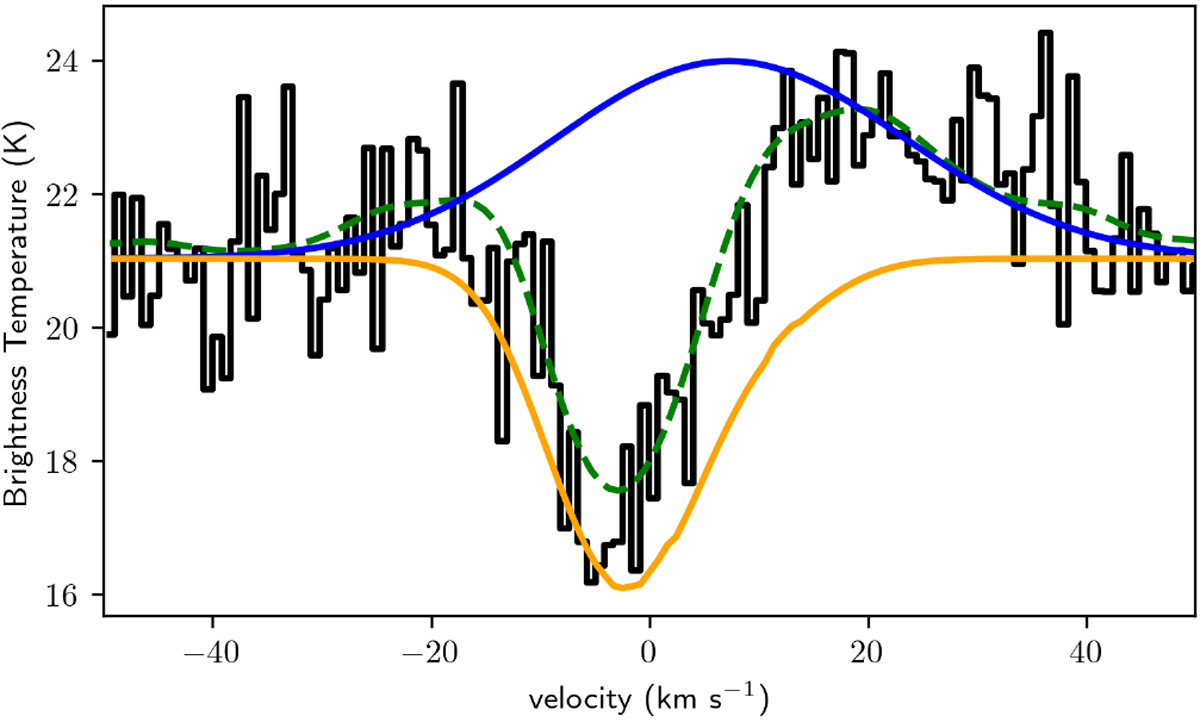
Spectrum of the 1 837 816.8 MHz transition of OH. The full LTE model of OH (green dashed line) is superposed on the HIFIspectrum (black histogram). The contribution of the core and the envelope are shown as blue and orange lines, respectively. In order to determine the integrated intensities of different components and velocity ranges we take only those components into account, which belong to a specific range. By doing so we neglect the contributions from other components as shown here. The sum of integrated intensities of core and envelope contributions is about a factor two higher than the integrated intensity of the full LTE model.
Current usage metrics show cumulative count of Article Views (full-text article views including HTML views, PDF and ePub downloads, according to the available data) and Abstracts Views on Vision4Press platform.
Data correspond to usage on the plateform after 2015. The current usage metrics is available 48-96 hours after online publication and is updated daily on week days.
Initial download of the metrics may take a while.