Fig. 8
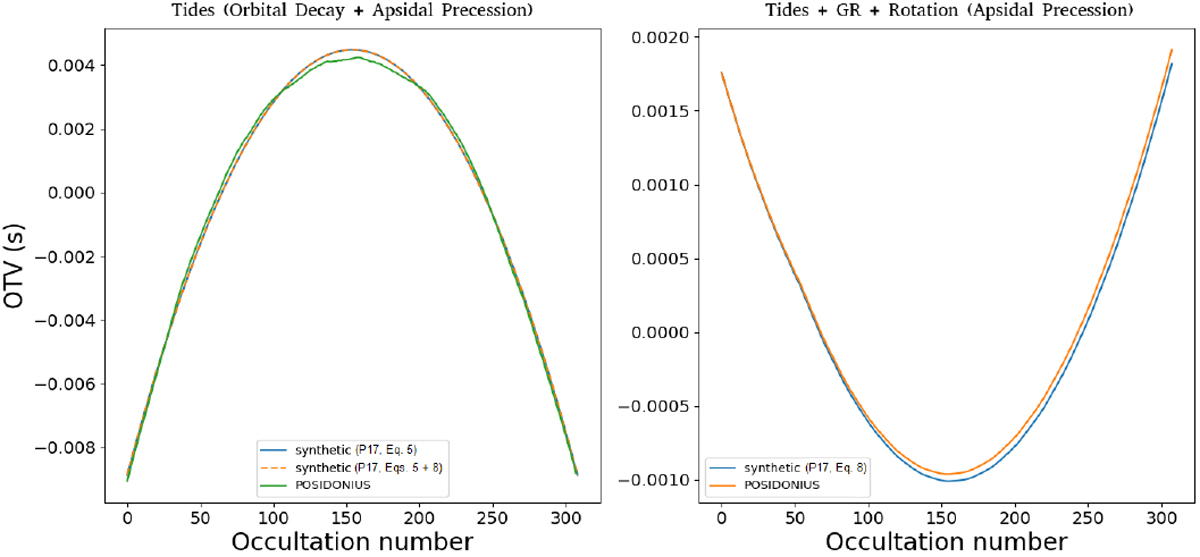
Occultation timing variations considering the same simulations of Fig. 3, i.e., a K2-265 b with e = 0.15, a synchronous rotation rate, and a viscosity of η = 1022 Pa s. The panel on the left shows the contribution of orbital decay and tidally induced apsidal precession to the OTVs, while the panel on the right shows the contribution of apsidal precession induced by three effects to the OTVs (i.e., for the latter, the effects of GR, tides, and rotation were considered). The synthetic OTV curves were generated by considering Eqs. (5) and (8) given in Sect. 4 of Patra et al. (2017), corresponding to P17 in the labels of the figure.
Current usage metrics show cumulative count of Article Views (full-text article views including HTML views, PDF and ePub downloads, according to the available data) and Abstracts Views on Vision4Press platform.
Data correspond to usage on the plateform after 2015. The current usage metrics is available 48-96 hours after online publication and is updated daily on week days.
Initial download of the metrics may take a while.