Fig. 3
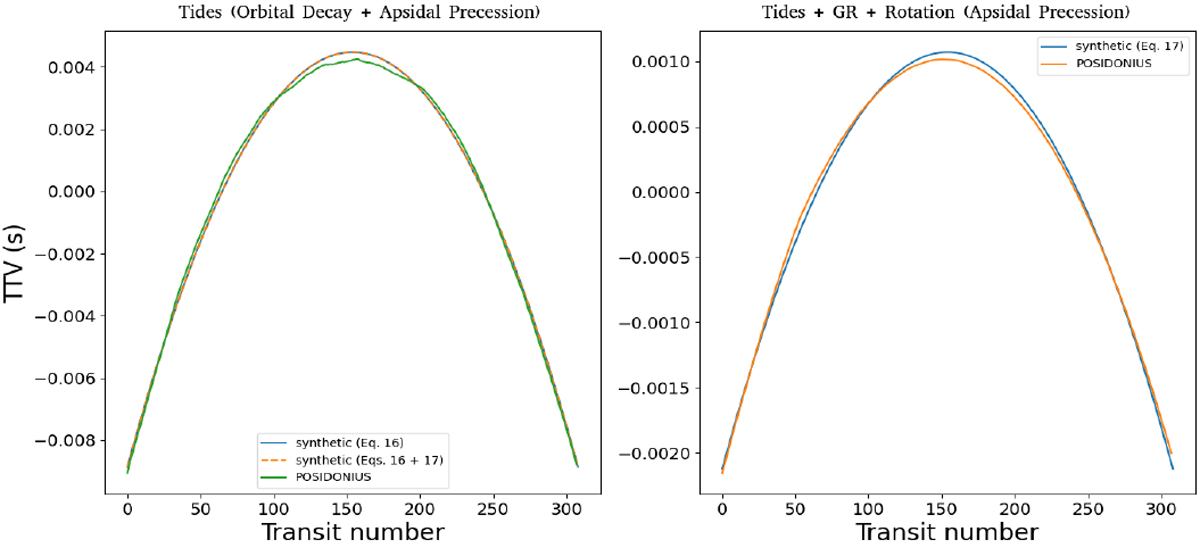
TTVs for K2-265 b, considering η = 1022 Pa s, e = 0.15, and a synchronous rotation rate for the planet. The results on the left were obtained considering only tidal interactions, while the results on the right were obtained by considering tides, rotation, and general relativity (the contribution coming from tidal decay to the TTVs on the orange curve were filtered out by directly subtracting the TTVs generated by employing Eq. (16)). The blue curves in the panels are synthetic TTV curves. The green curve in the left panel and the orange curve in the right panel correspond to the results coming from the Posidonius code.
Current usage metrics show cumulative count of Article Views (full-text article views including HTML views, PDF and ePub downloads, according to the available data) and Abstracts Views on Vision4Press platform.
Data correspond to usage on the plateform after 2015. The current usage metrics is available 48-96 hours after online publication and is updated daily on week days.
Initial download of the metrics may take a while.