Fig. 2
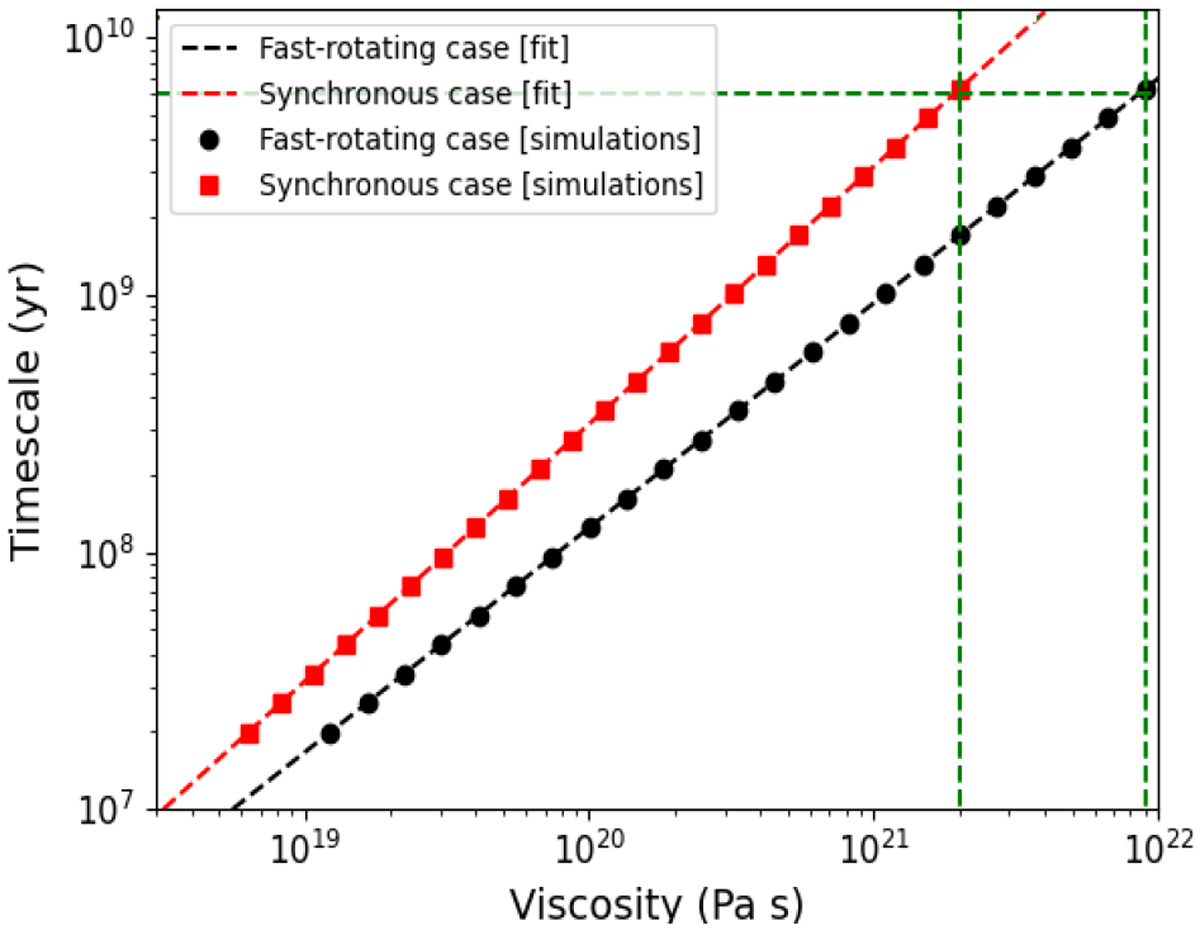
Timescales of orbital circularization for K2-265 b. The red squares (resp. black dots) are the data obtained from the numerical integrations employing the secular code for the initially synchronous (resp. fast-rotating) planet case. The red (resp. black) dashed curves are the corresponding least-square fittings of the results coming from the secular code experiments. The green dashed vertical line on the left (resp. right) is the lower value of the viscosity for which we can reproduce the planet’s current range of eccentricity values for the initially synchronous (resp. fast-rotating) planet case, with τ = τcirc = 6.7 Gyr.
Current usage metrics show cumulative count of Article Views (full-text article views including HTML views, PDF and ePub downloads, according to the available data) and Abstracts Views on Vision4Press platform.
Data correspond to usage on the plateform after 2015. The current usage metrics is available 48-96 hours after online publication and is updated daily on week days.
Initial download of the metrics may take a while.