Fig. 7
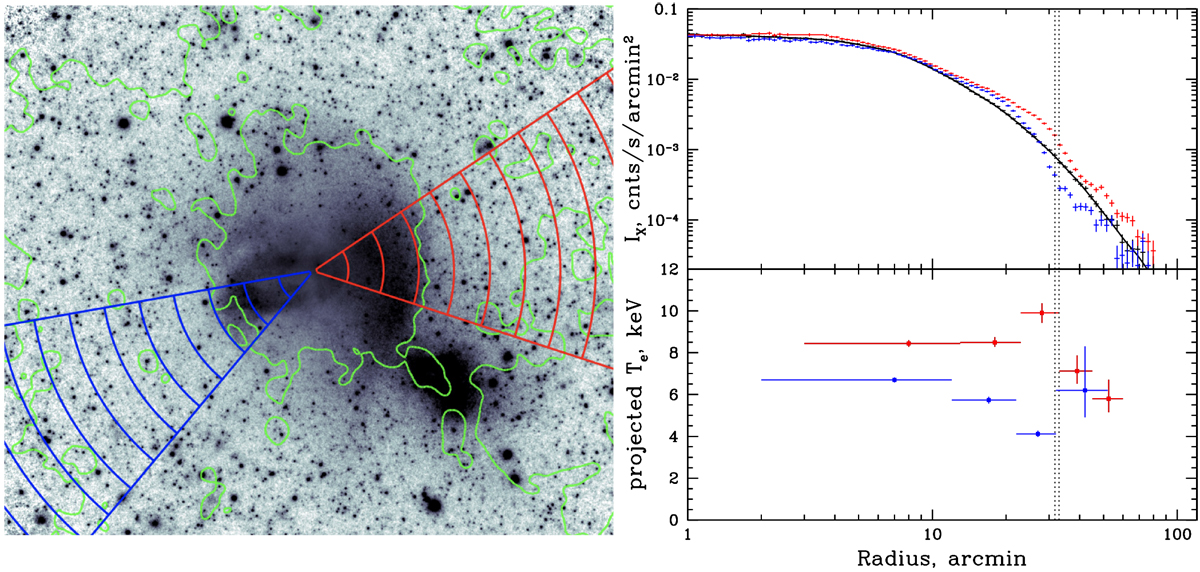
Characterization of two sharp features in the X-ray image to the east and west of the Coma core. Left: two wedges used for extraction of the X-ray surface brightness and the spectral analysis. The flattened X-ray image is used as a background. For convenience, 10′ rings are shown. The green contours show the brightness of the WSRT radio image at 352 MHz (Brown & Rudnick 2011). The inner contours approximately correspond to the boundary of the Coma radio halo. Right: surface brightness and projected temperature profiles to the west (in red) and to the east (in blue) of the Coma center. To highlight surface brightness gradients, the top panel shows also the azimuthally averaged profile IX (the sameas in Fig. 5) in black. To the west, sharp surface brightness discontinuity at R ≃ 33 arcmin coincides with the temperature decline. Thus, our observations confirm the presence of a shock wave in the west with the Mach number of M ≃ 1.5. The dotted line marks the position of the shock. To the east, we observe that the denser region is colder than the more rarefied region, thus making the eastern feature the cold front. The dotted lines show the positions of the X-ray surface brightness jumps.
Current usage metrics show cumulative count of Article Views (full-text article views including HTML views, PDF and ePub downloads, according to the available data) and Abstracts Views on Vision4Press platform.
Data correspond to usage on the plateform after 2015. The current usage metrics is available 48-96 hours after online publication and is updated daily on week days.
Initial download of the metrics may take a while.