Fig. 5
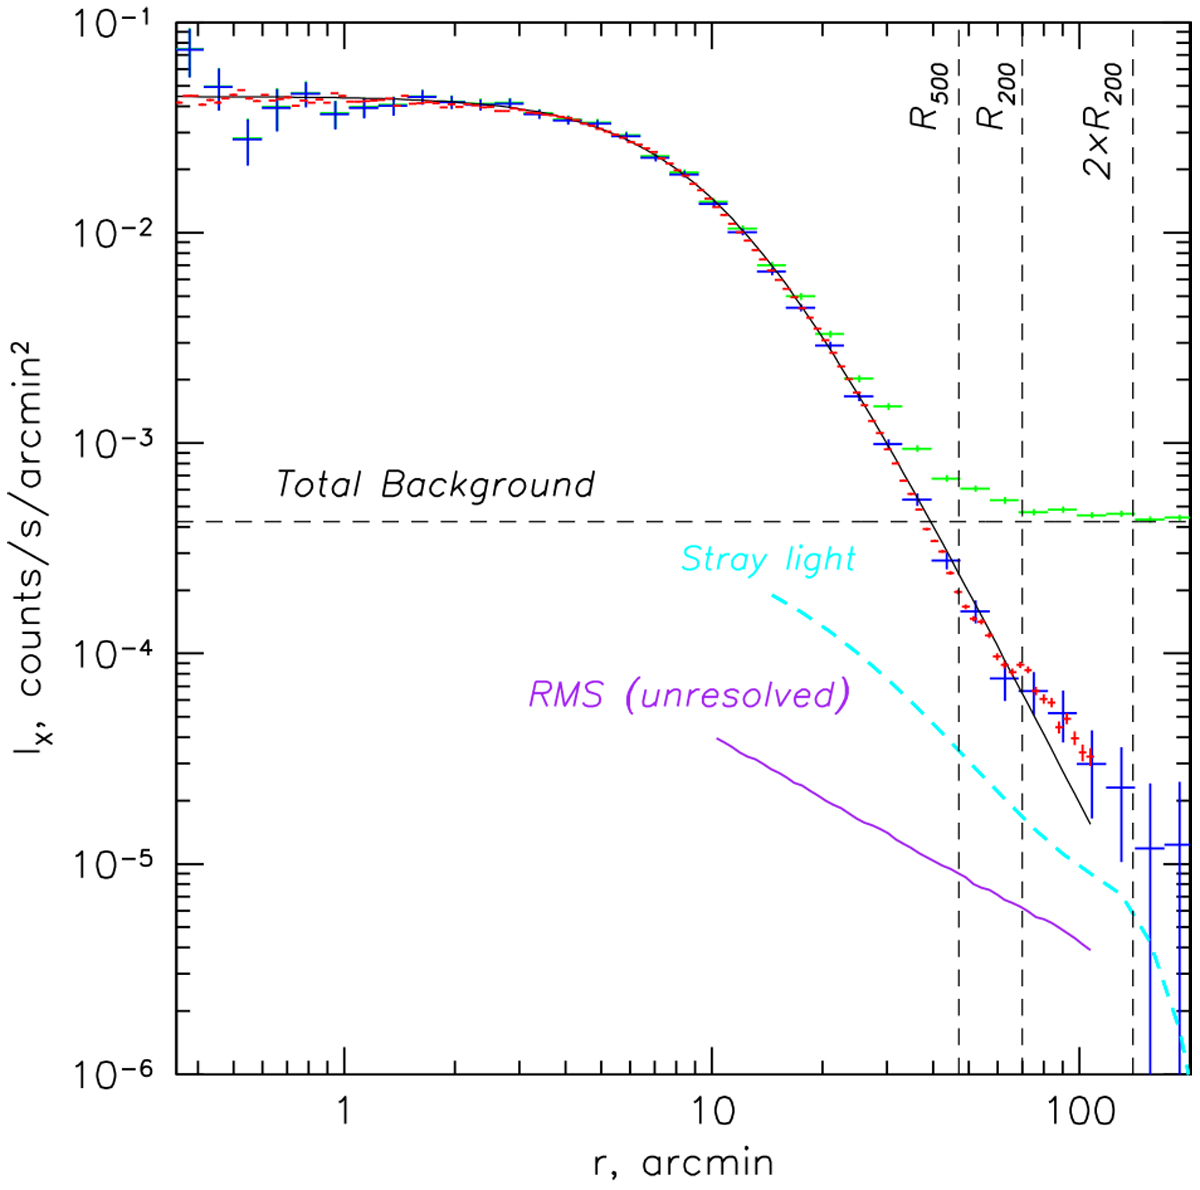
Radial surface brightness profile of the Coma cluster in the 0.4–2 keV band. The surface brightness is normalized per single (out of seven) eROSITA telescopes. The 90° wedge in the SW direction, which contains the NGC 4839 group, has been excluded from the analysis. The green points show the raw surface brightness (including all types of the background) as measured in the all-sky survey. The blue points are the same data after excising compact sources and removing different types of the residual background and foreground (both instrumental and astrophysical), and subtracting the estimated contribution of the stray light. The red points show similarly processed data from the data set discussed in this paper. For comparison, the thin black line shows a β−model with the co-radius rc = 10′ and β = 0.73. Three vertical lines show R500, R200, and 2 × R200. The dashed horizontal line shows the total background in the 0.4–2 keV band. The cyan curve shows the estimated level of the stray light, which was removed from the profiles. At the moment of writing, the exact shape and normalization of this component are still uncertain. Finally, the purple line shows the estimated level of flux variations associated with the Poisson fluctuations of the number of unresolved sources (in the outer regions where the Coma contribution is subdominant).
Current usage metrics show cumulative count of Article Views (full-text article views including HTML views, PDF and ePub downloads, according to the available data) and Abstracts Views on Vision4Press platform.
Data correspond to usage on the plateform after 2015. The current usage metrics is available 48-96 hours after online publication and is updated daily on week days.
Initial download of the metrics may take a while.