Fig. 4
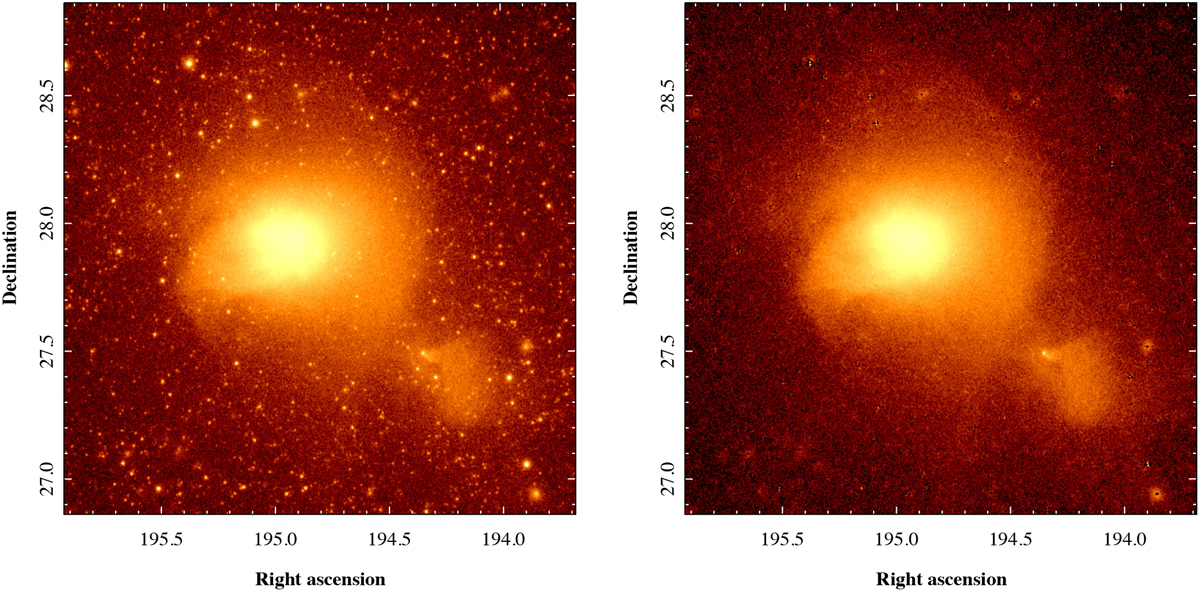
X-ray image of the central ~2 × 2 degrees of the field showing 0.4–2 keV surface brightness on a logarithmic scale. Left panel: original image without subtraction of the multitude of foreground, background and Coma-related sources. Right panel: map of the diffuse emission obtained after modeling and subtraction of the confidently detected point-like and mildly extended sources using the β-profile approximation of the PSF described in Appendix B.
Current usage metrics show cumulative count of Article Views (full-text article views including HTML views, PDF and ePub downloads, according to the available data) and Abstracts Views on Vision4Press platform.
Data correspond to usage on the plateform after 2015. The current usage metrics is available 48-96 hours after online publication and is updated daily on week days.
Initial download of the metrics may take a while.