Fig. D.1
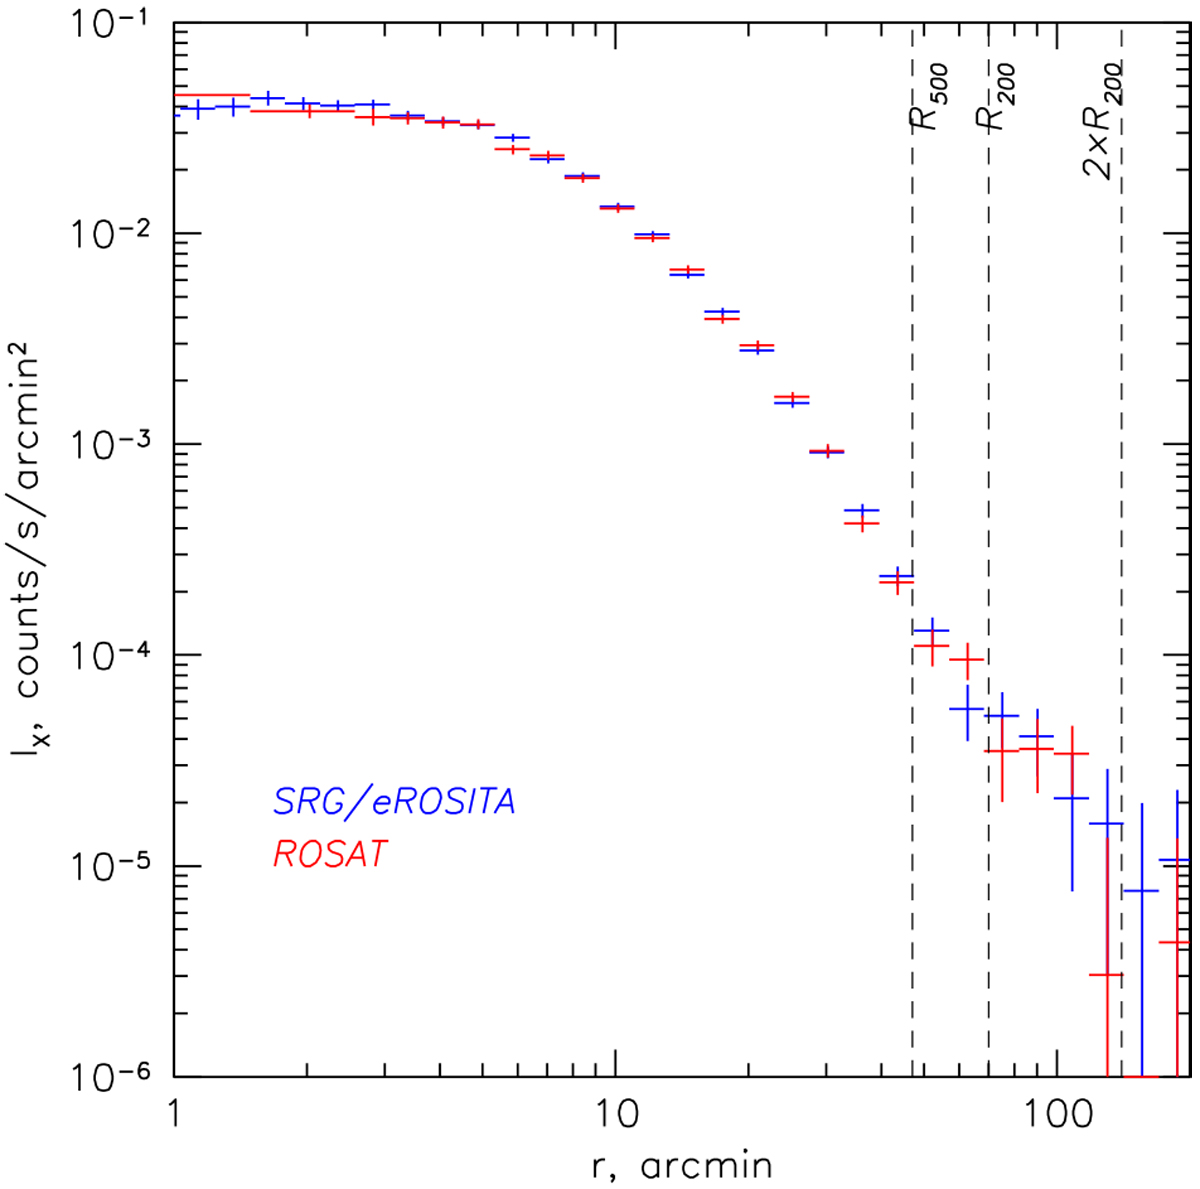
Comparison of the ROSAT and eROSITA radial profiles of the Coma cluster. In both cases, the data from the all-sky surveys are shown. For ROSAT (red points), the data in the 0.4–2.4 keV were used. As in Fig. 5, the 90 degrees wedge to the SW (containing NGC4839 group) has been excluded. The eROSITA points (blue crossed) are the same as in Fig. 5. The ROSAT profile has been renormalized to match the eROSITA data. The shapes of the two profiles agree well.
Current usage metrics show cumulative count of Article Views (full-text article views including HTML views, PDF and ePub downloads, according to the available data) and Abstracts Views on Vision4Press platform.
Data correspond to usage on the plateform after 2015. The current usage metrics is available 48-96 hours after online publication and is updated daily on week days.
Initial download of the metrics may take a while.