Fig. 10
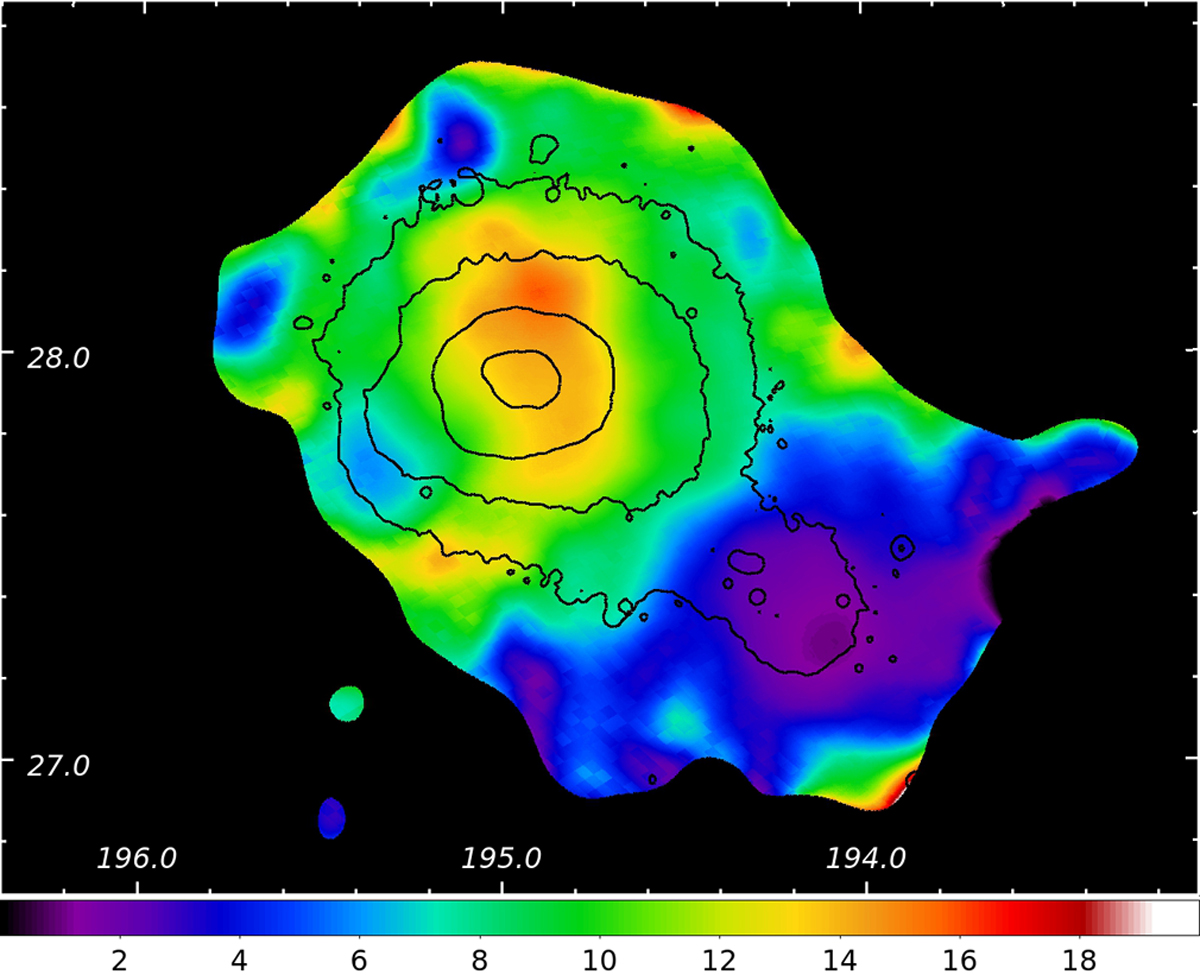
Ratio of SZ and X-ray images of the Coma cluster, converted to the weighted electron temperature in keV. Contours show the X-ray surface brightness. Only the inner part of the studied region, where the signal is strong enough to evaluate the ratio of two images is shown. There are three clear features in the derived temperature distribution – a cool region at the position of the NGC 4839 group, a (marginally) hotter region to the north of the core and another cool region near the contact discontinuity to the east of the core.
Current usage metrics show cumulative count of Article Views (full-text article views including HTML views, PDF and ePub downloads, according to the available data) and Abstracts Views on Vision4Press platform.
Data correspond to usage on the plateform after 2015. The current usage metrics is available 48-96 hours after online publication and is updated daily on week days.
Initial download of the metrics may take a while.