Fig. 2
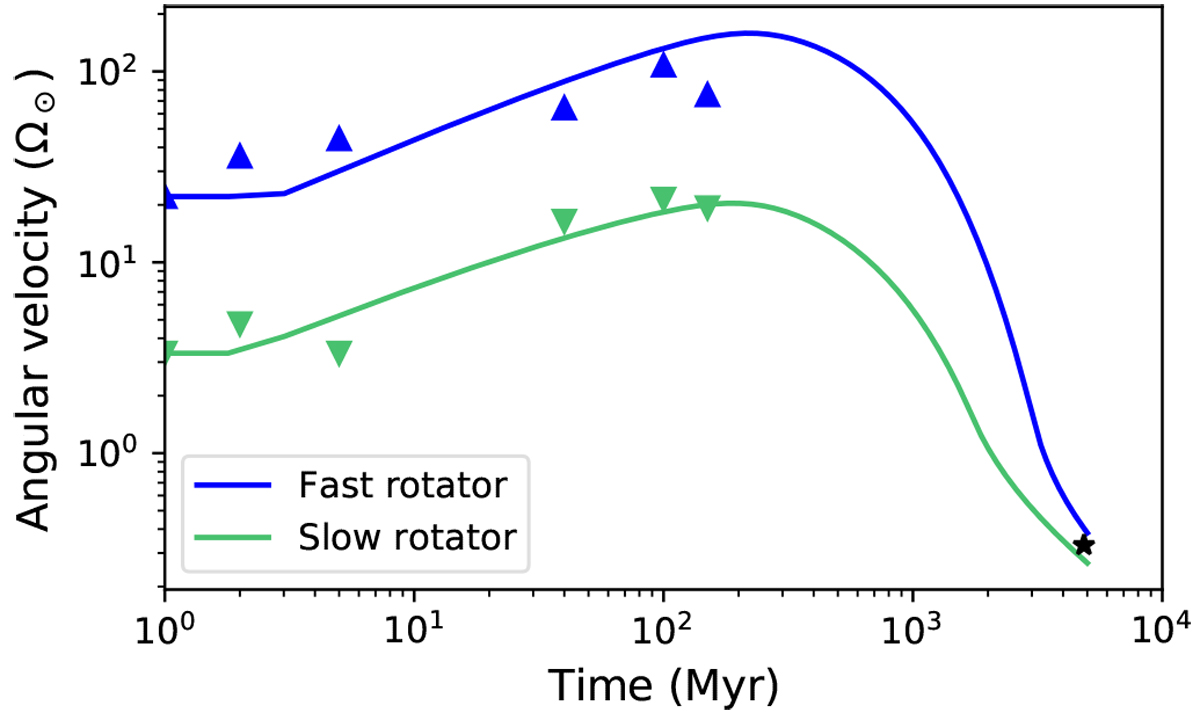
Possible rotational evolution tracks of Proxima Cen (1 Ω⊙ = 2.67 × 10⁻⁶ rad s−1). The black star shows the modern observed rotation rate of Proxima Cen, which corresponds to a rotation period of ~ 82.5 days. The triangles indicate the observational constraints on the 10th and 90th percentiles of the rotational distributions from Irwin et al. (2011). The purple line corresponds to the evolution track of a fast rotator, the green line shows the evolution track of a slow rotator. All values in between are also possible.
Current usage metrics show cumulative count of Article Views (full-text article views including HTML views, PDF and ePub downloads, according to the available data) and Abstracts Views on Vision4Press platform.
Data correspond to usage on the plateform after 2015. The current usage metrics is available 48-96 hours after online publication and is updated daily on week days.
Initial download of the metrics may take a while.