Fig. 7.
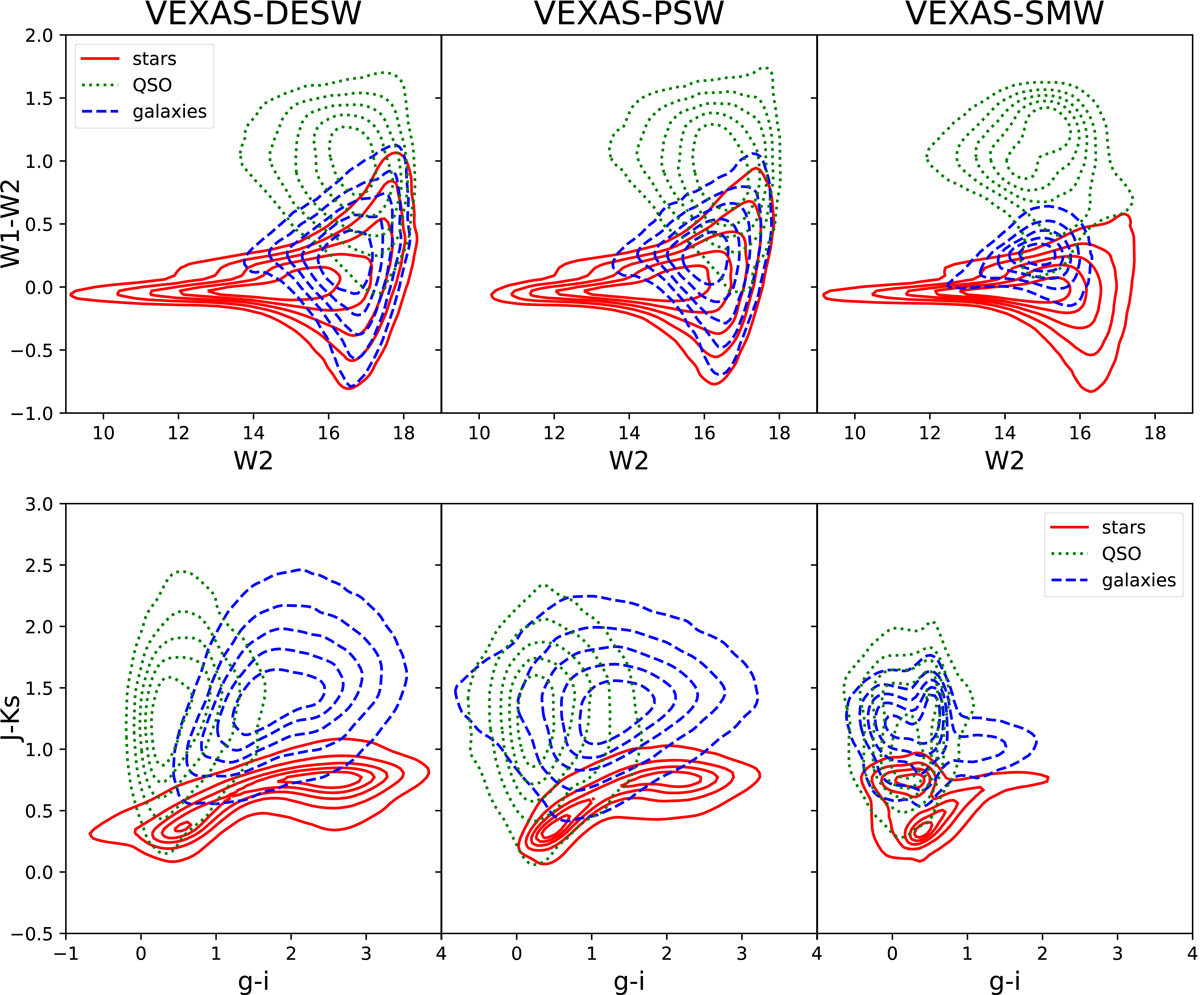
Selected colour-colour and magnitude-colour diagrams of VEXAS high-confidence (pclass = 0.7) STAR (red contours), QSO (green contours), and GALAXY (blue contours), over the three optical footprints (VEXAS-DESW, left column, VEXAS-PSW, middle column, and VEXAS-SMW right column), split according to the predicted class. Bottom right panel: issue with the imputation for VEXAS-SMW, which is described in detail in Sect. 6 and in Appendix C.3.
Current usage metrics show cumulative count of Article Views (full-text article views including HTML views, PDF and ePub downloads, according to the available data) and Abstracts Views on Vision4Press platform.
Data correspond to usage on the plateform after 2015. The current usage metrics is available 48-96 hours after online publication and is updated daily on week days.
Initial download of the metrics may take a while.